 Recently, silver seems to be more and more resistant to falls.
Although in recent days there has been a slight drop in prices, so far it looks like a pullback to the nearest support from the daily chart.
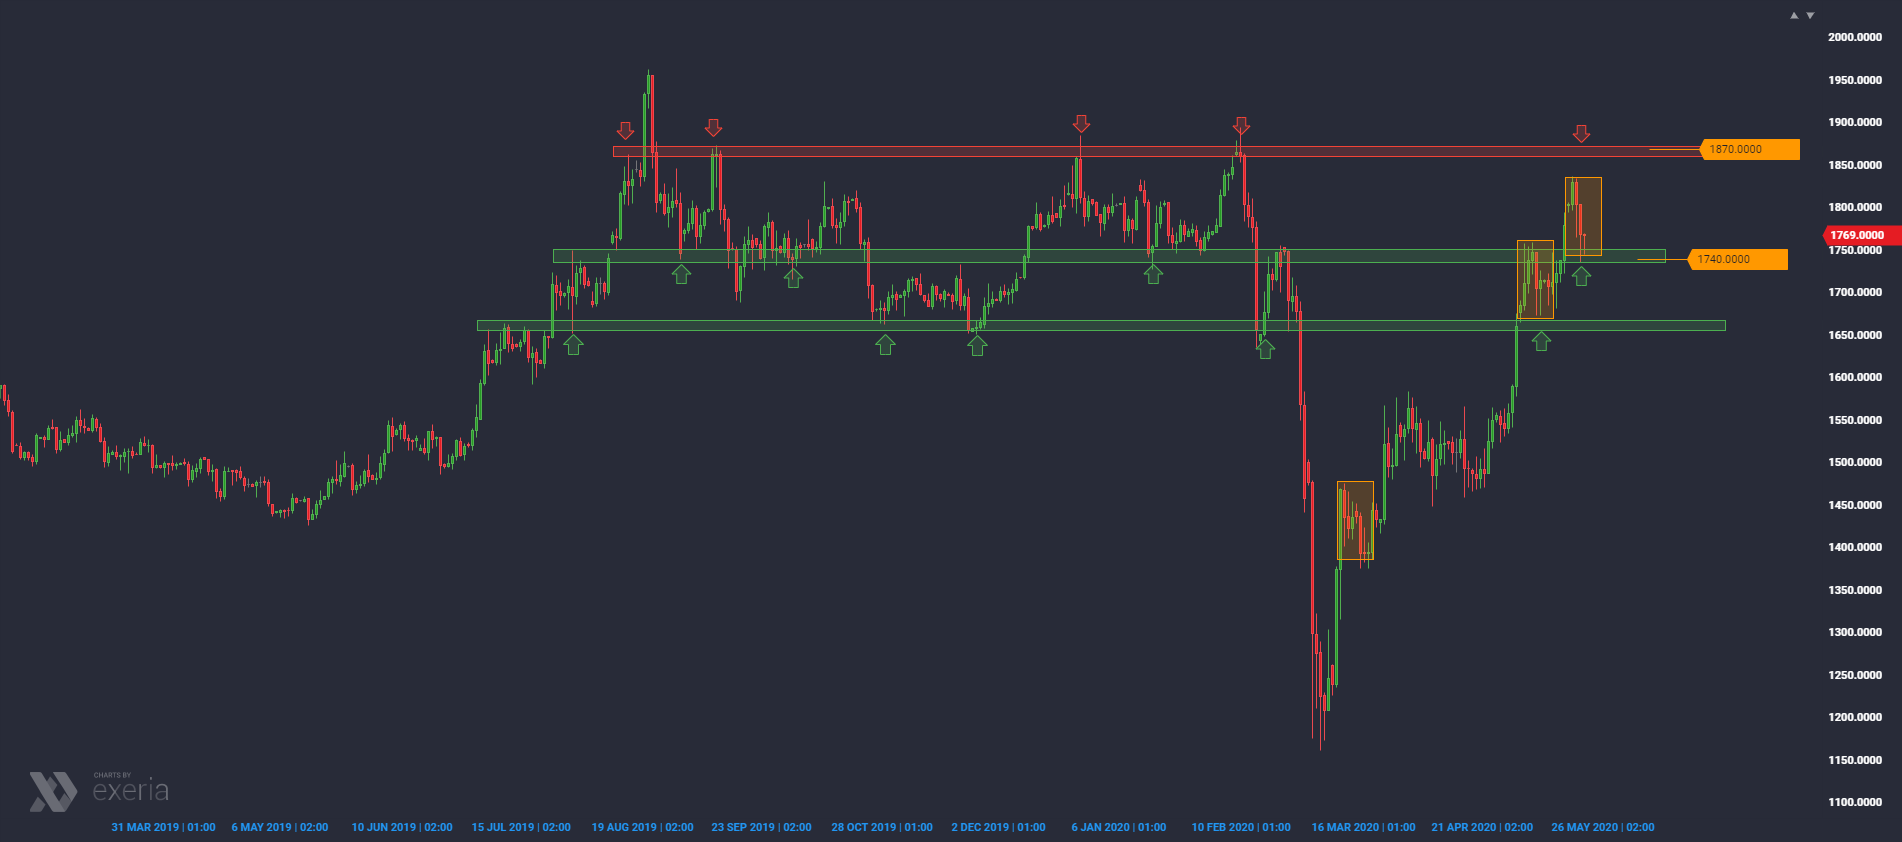
These are around 1740 ¢ / ozt, where you will find an internal area that in the past was both support and resistance. This level has already been noticed by the market. Yesterday, the bottom shadow of a candle appeared within it. Also today, buyers have reacted here again. By the way, it is noteworthy that the last two corrections on this scale are equal (I marked them with orange rectangles). Such a 1: 1 correction is also an argument for bulls who now have at their fingertips an attack on another resistance at 1870 ¢ / ozt (highs from the turn of this year).
A wider horizon on the silver market
In recent months, there has been a lot of interest in precious metals, especially gold. Investors usually look at gold in a market uncertainty, which was very high in February and March. The demand turned out to be so high that the price of “paper” gold (derivatives) was moved away from the physical (also due to logistical problems / interrupted supply chains), of course in favor of the physical. Dealers’ margins began to reach tens of percent above the Comex price in many places.
In addition to risk aversion, the second factor favoring gold is the policy of central banks, which, as we know, have started solidarity in loosening monetary policy (lowering interest rates, but above all increasing QE’s). The level of interest rates relative to real inflation is also very important. Currently, the standard is that real rates are negative in many places around the world, so money holders are not able to store their value in standard deposits or bonds. Given the announcement of central bankers, seeking at all costs to devalue growing debt inflation, we can be sure that the environment of negative real interest rates will remain with us for a long time, and this creates a solid foundation for precious metals in the coming years (see the decade of the ‘ 70).
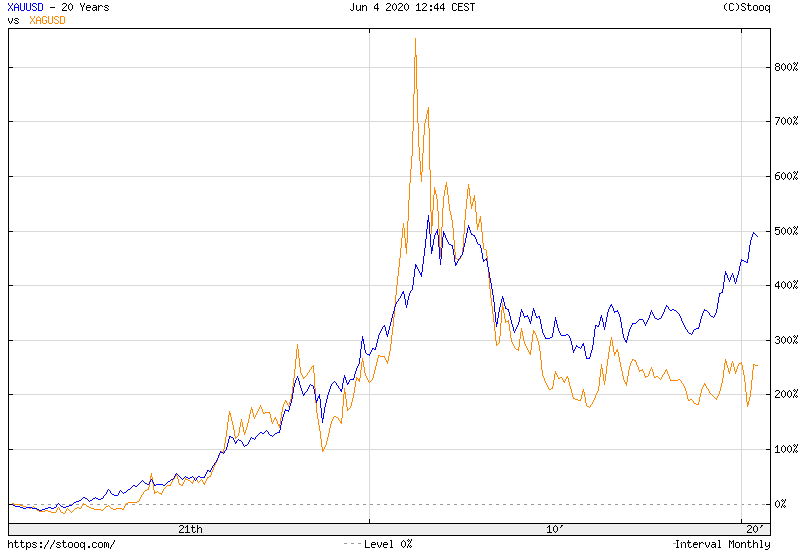
While gold has already seen a significant rise in prices over the past few quarters, silver should pay attention, as it is correlated in long term with gold, and as you can see in the chart above, it has considerable disproportions. Their appearance was argued that silver is partly an industrial metal due to its possible use. The expectation of an economic slowdown caused by the effects of the current pandemic has led to strong declines in many commodities. However, it should be remembered that commodities are doing very well during rising inflation, which is a scenario that seems to be the logical consequence of maintaining real negative interest rates by central banks.
The currently visible decline in inflation is temporary. It should be remembered that inflation depends on both the money supply and the pace of its circulation. Due to global lockdown, it was the latter element that caused inflation to lose dynamics. However, when the economy is completely resumed and the money supply remains at its current level, inflation should noticeably accelerate, increasing the flight from cash to tangible assets, including precious metals and commodities. Silver in this environment will get a strong, positive stimulus.
Gold-silver ratio
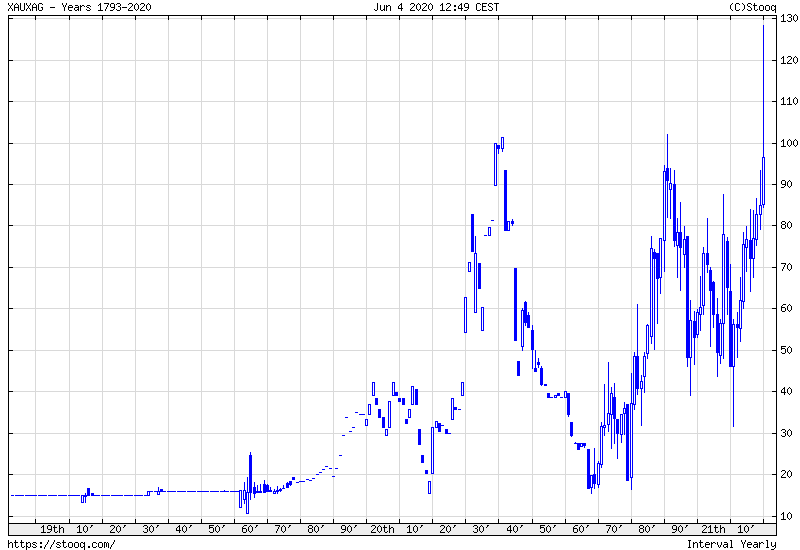
The recent divergence of silver and gold prices is also well illustrated by the relative strength chart, which at one point fired to historically high levels under 130 silver units per gold unit. Over the past few decades, this indicator fluctuated in the range of about 40-100. It can therefore be assumed that it will ultimately target at least the average of 60-70 XAU / XAG. The price of silver can therefore increase much faster than gold.
March bull trap and Wyckoff’s model
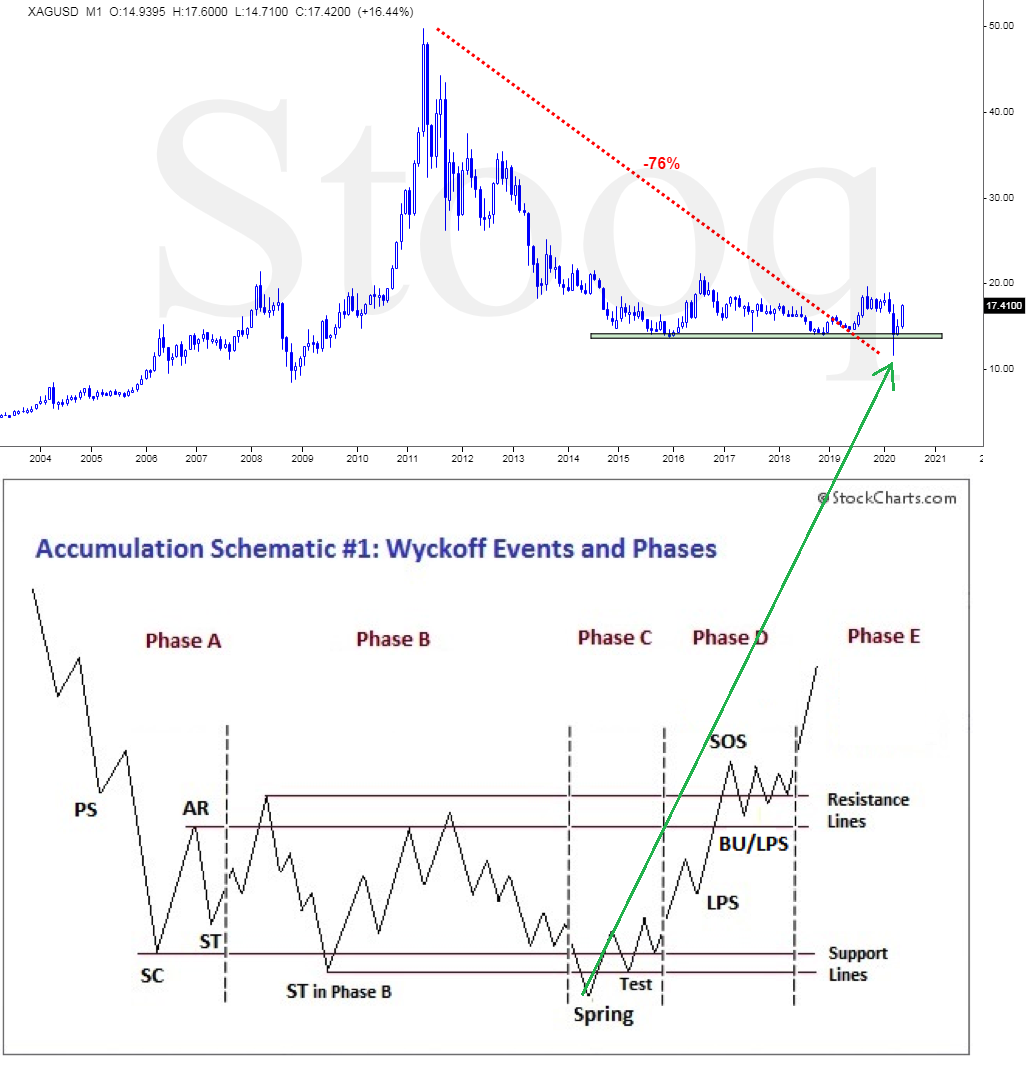
So it’s time to take a look at the silver chart from a longer perspective. From the high of 2011 to the recent low, the price fell by over 76%. It can therefore be assumed that the market is “cleaned”. The decline basically stopped already in 2016, and since then a horizontal trend has been built, which can also be determined by the accumulation phase. The recent breaking of the lows from recent years and a quick return (on the monthly candle only the bottom shadow violation) was a classic bull trap. Who had localized SL’s under lows (very clear, horizontal support) was thrown out of the market. This situation is similar to Wyckoff’s accumulation model. It can therefore be assumed that we are currently in phase C on silver.


 Review")


