The chart for the EURAUD currency pair has a rather unusual shape. In March, when the global pandemic caused by the covid-19 virus started, the quotations fired up very dynamically to 1.9800, setting a maximum of this year.
- Head and Shoulders formation
- neck line under gunfire
Since 19 March, ratings have been falling steadily to stabilise at the levels of January and February – that is, before the sharp increases caused by the pandemic.
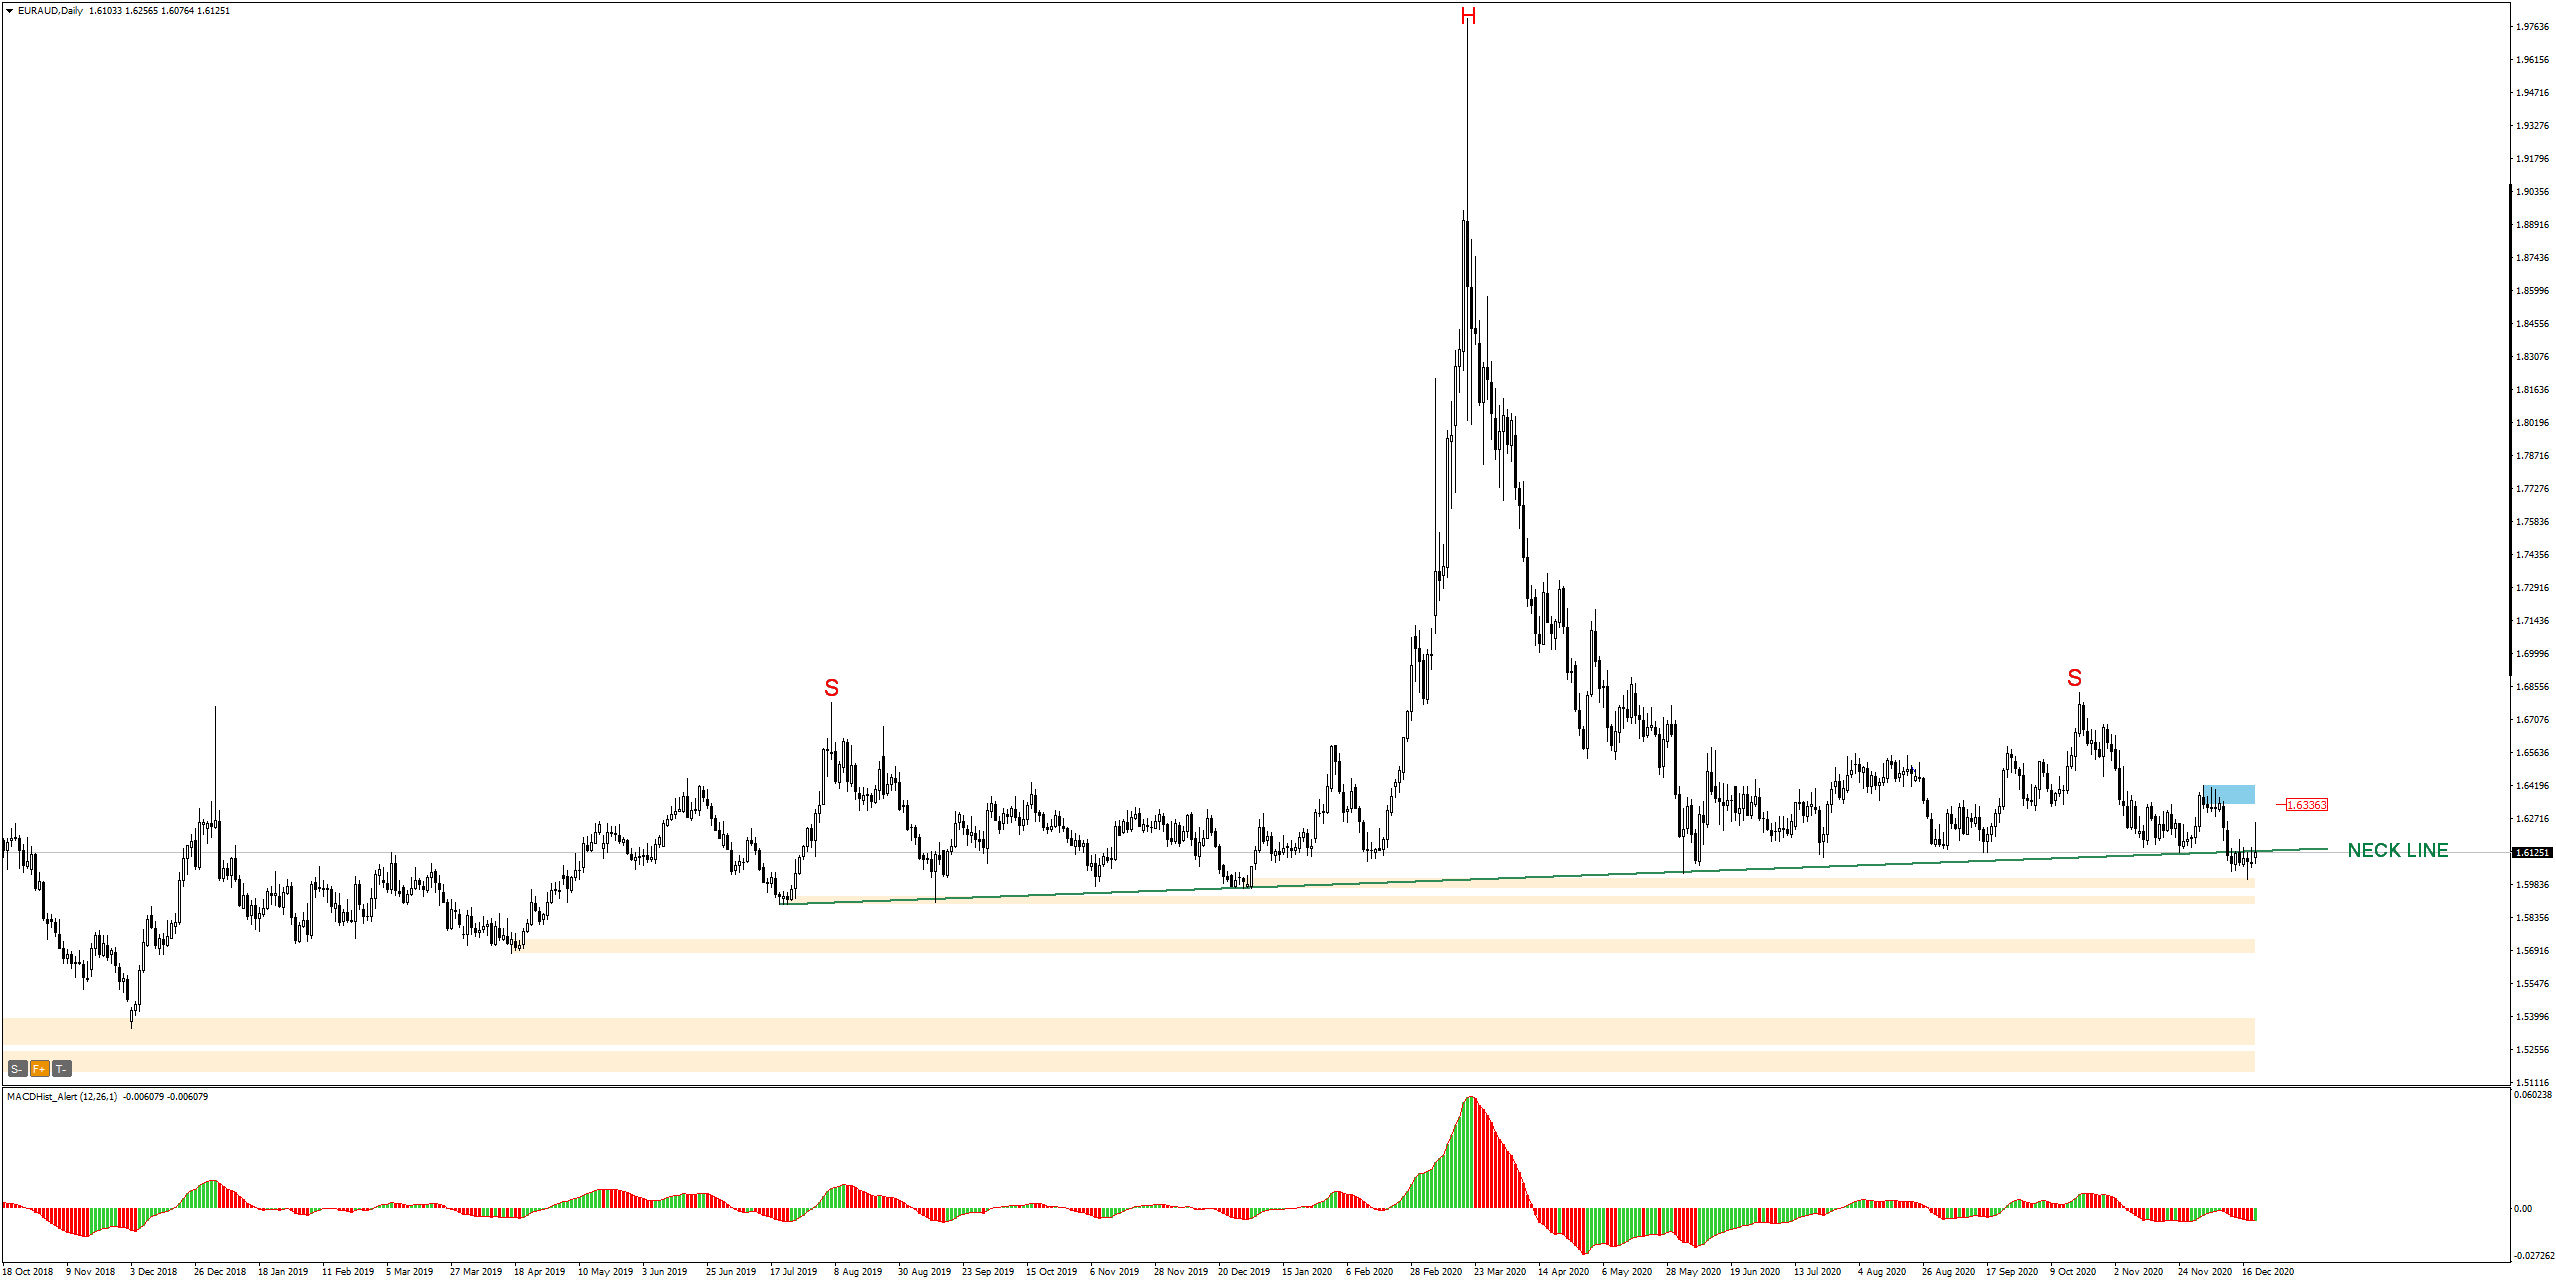
On the daily chart we can see a familiar head and shoulder formation – the H&S
Price has already tried to overcome the neck line several times, the natural support of this formation, but to this day these attempts were ineffective and the price was returning above the mentioned neck level.

Today, the situation seems to be more favourable for the Australian dollar, and perhaps we will finally see the support of this strongly ‘stretched’ H&S formation being broken. This would be a signal to continue the declines.
The closest supply target may be the demand zone located 50p below the neck line – around 1.6070.
The condition for the downward scenario to work is to overcome the green neck line and the local trend line (dashed blue).
I also recommend this stuff:
Trading with PA+MACD, or how to increase the probability of winning
ongoing analysis https://t.me/TradewithDargo
 In our Facebook group, which you can join anytime: https://www.facebook.com/groups/328412937935363/ you will find 5 simple strategies on which my trading is based. There, every day we post fresh analyses of currency pairs and commodities. You can also visit my channel where I post my trading ideas: https://t.me/TradewithDargo


 Review")


