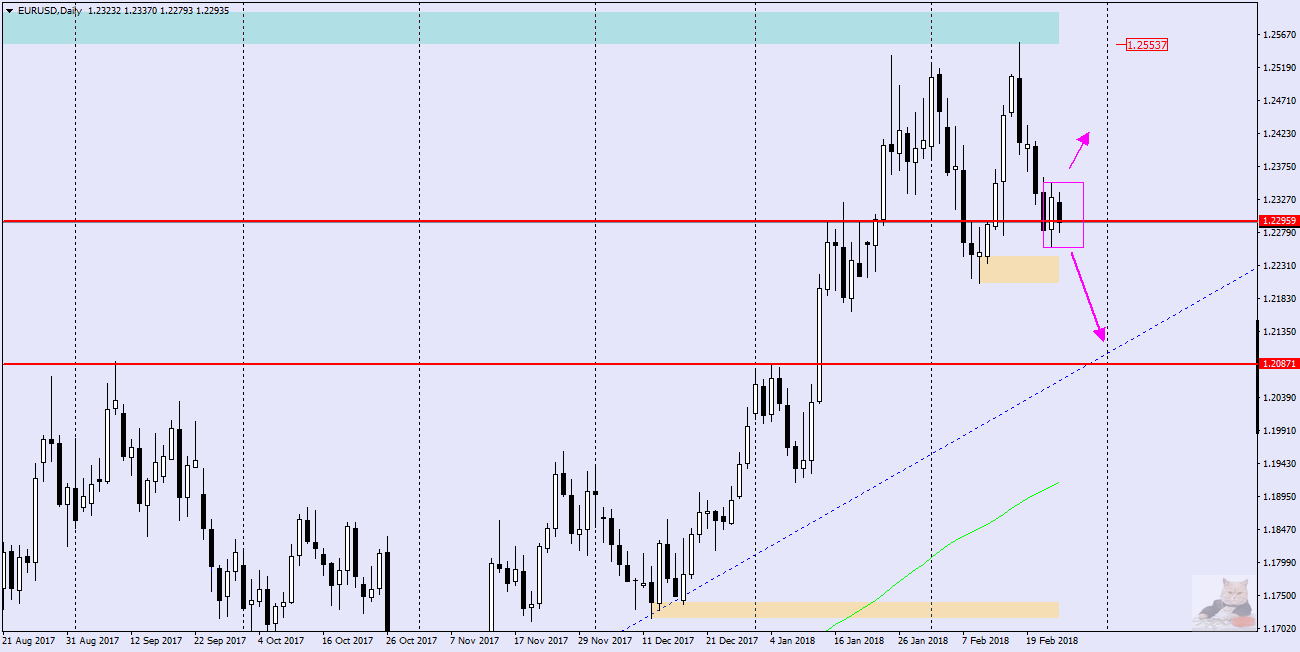
EURUSD – when the last time I analysed the situation on this pair, the price was on confluence of supports (1.2300) and I expected that publication of the FOMC protocols can give an impulse and show the direction for this pair for the upcoming sessions. Partly, these predictions have come true, although not entirely … Although the pair beat the mentioned level, falling to 1.2256, but on Thursday returned over to again be in the vicinity of it on Friday (1.2295). This behavior of the price caused that an formation of Inside Bar occurred where the Friday quotations are completely contained in the Thursday candle day. The range of the “mother” candle is marked with a rectangle and covers a range of approximately 100 pips (1.2352 – 1.2256).
What’s next ?
If the IB formation will be held in accordance with the current short-term direction which began after the Bearish engulfing week ago, we can count on a breakthrough of IB’s lower limit and declines to the nearest support, ie 1.2242 and further 1.2215. Also tempting may be the level of maximums from the beginning of the year 1.2085, but it may turn out to be more distant in time.
However, if the price chooses the direction to the north, the signal to resign from orders Sell will be overcoming of the upper limit of the IB (1.2352) and staying there after the closing of the next session.
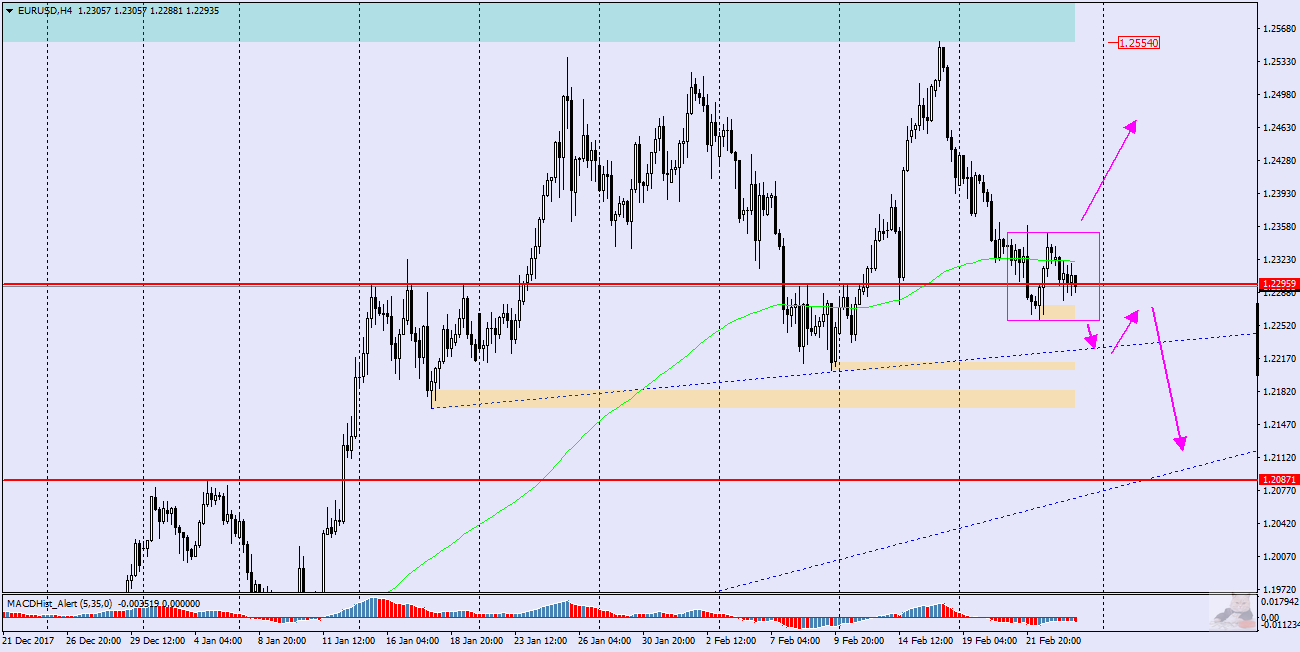
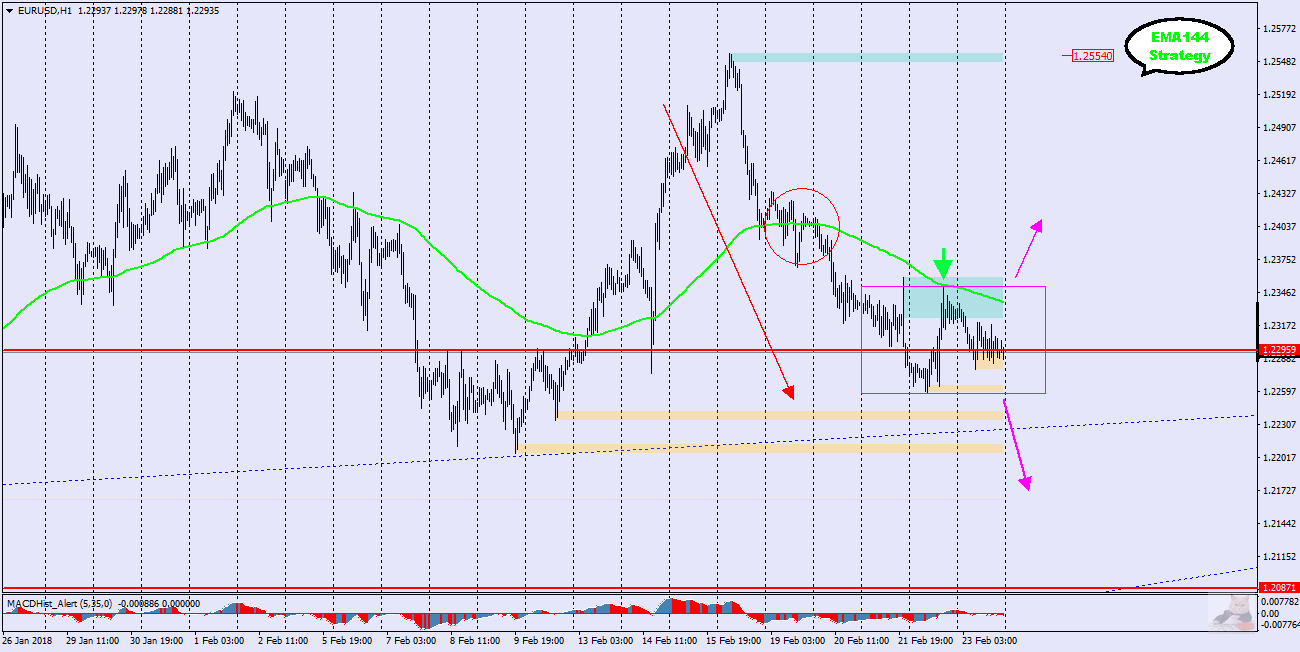
Another point of view (EMA144)
If we look at the situation in terms of EMA144 strategy, we will notice that the price with the accuracy of one pip touched the average and went south again, that is, it fulfilled all the assumptions of the strategy. In the previous analysis I mentioned that until the price is below the average we can count on further declines, but now if the IB should be broken thru the top, the price will automatically be above EMA144 – this may mean the end of hope for declines and bears will have to give back the market to the bulls.


 Review")


