From Investor to Scalper is a cycle of analysis in which we take one financial instrument and the analysis includes a detailed look at the value from the monthly/weekly chart to the H1/M15.
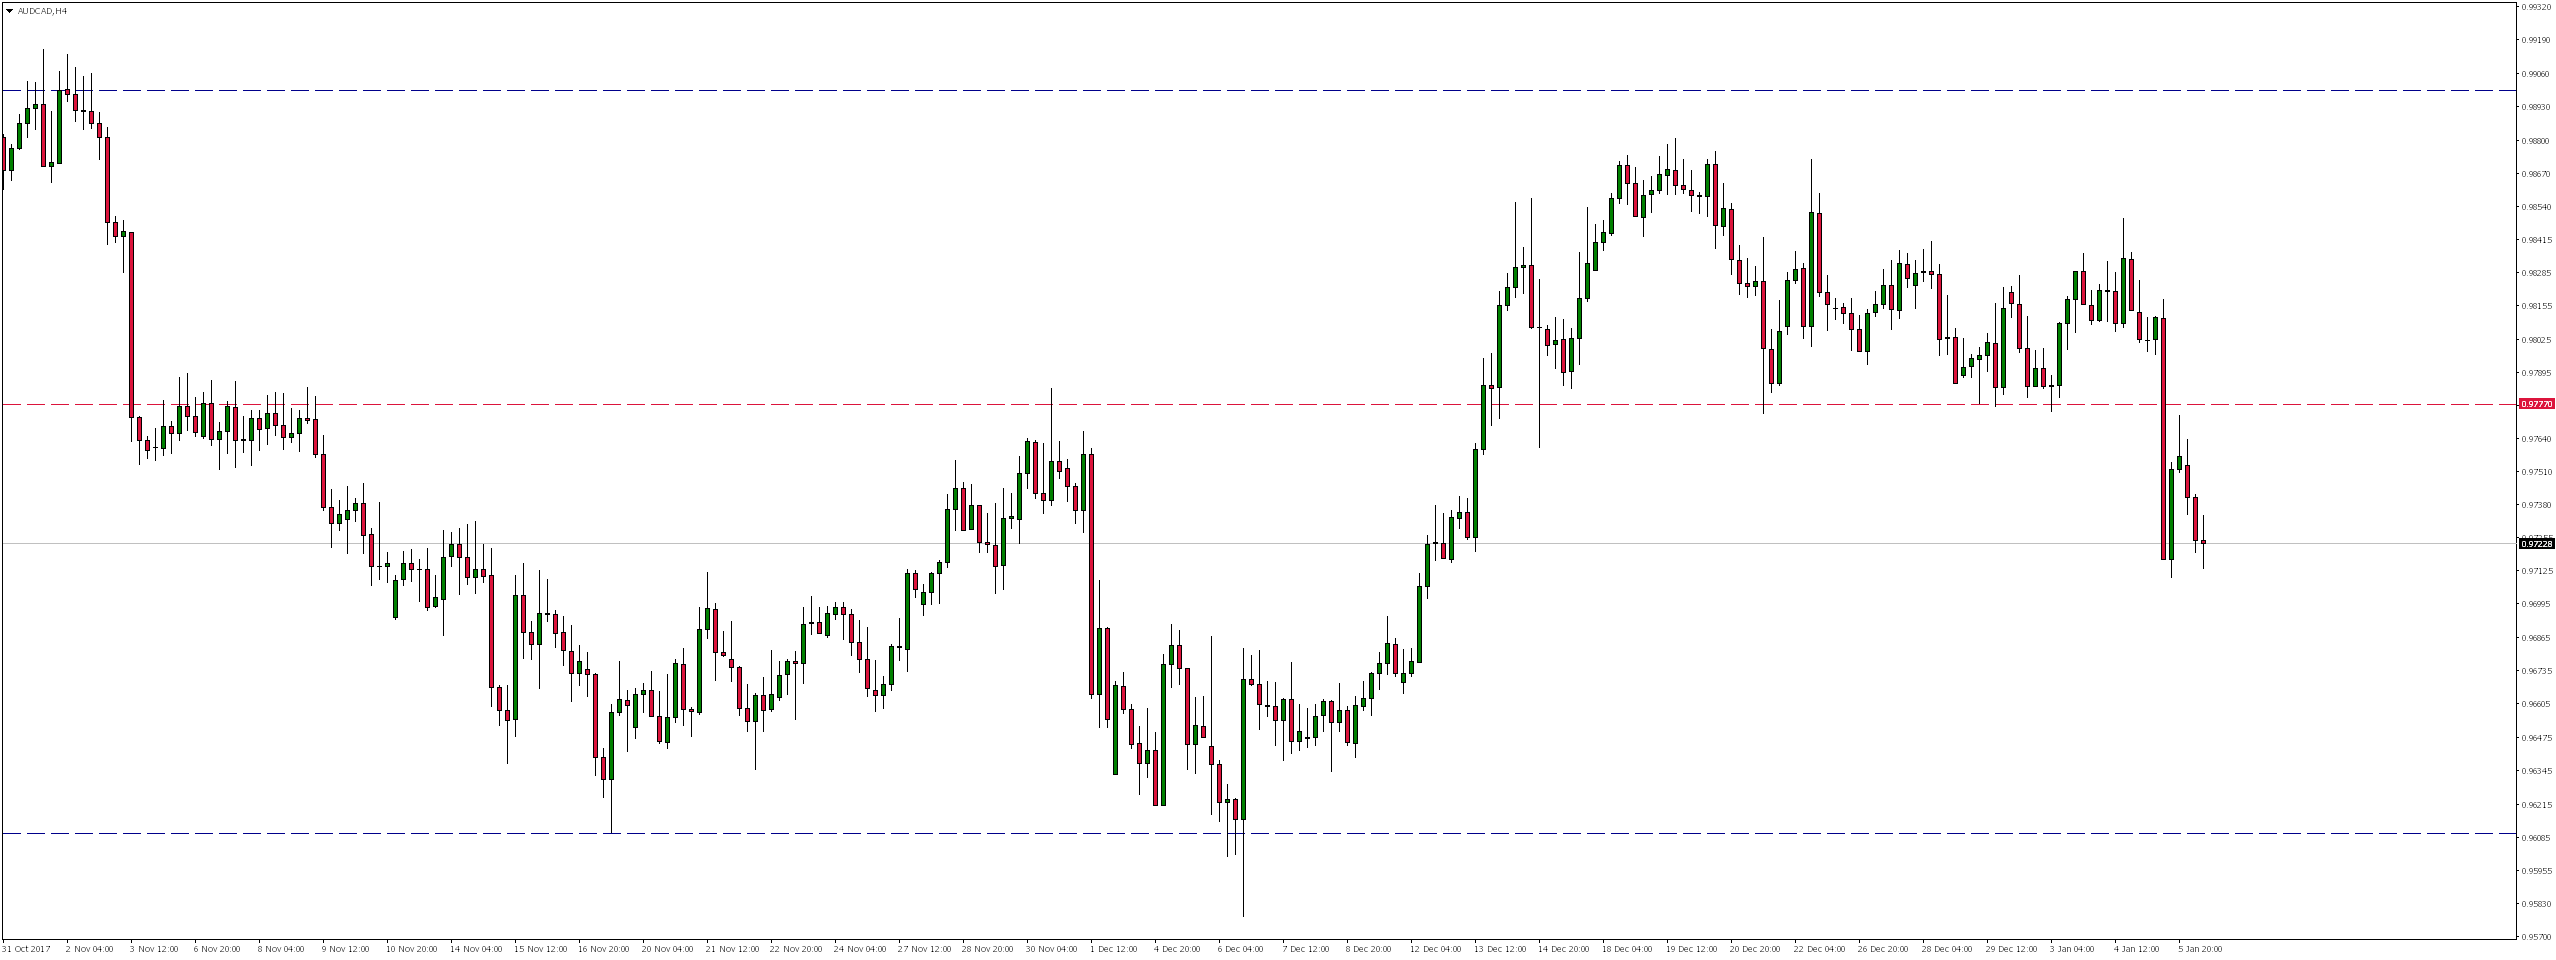
AUDCAD has been in a horizontal trend since August 2013. As a result of the lasting since May last year declines after the rejection of the upper limit of this consolidation, the rate reached and crossed the upward trend line. In the near future, we could expect continuation of declines.

Looking at the weekly interval, we can see that potential drops could reach even vicinity of level 0.9170, ie the support of consolidation. For this to happen, however, the market would have to overcome local (blue) support in the area of last and this year’s minima.

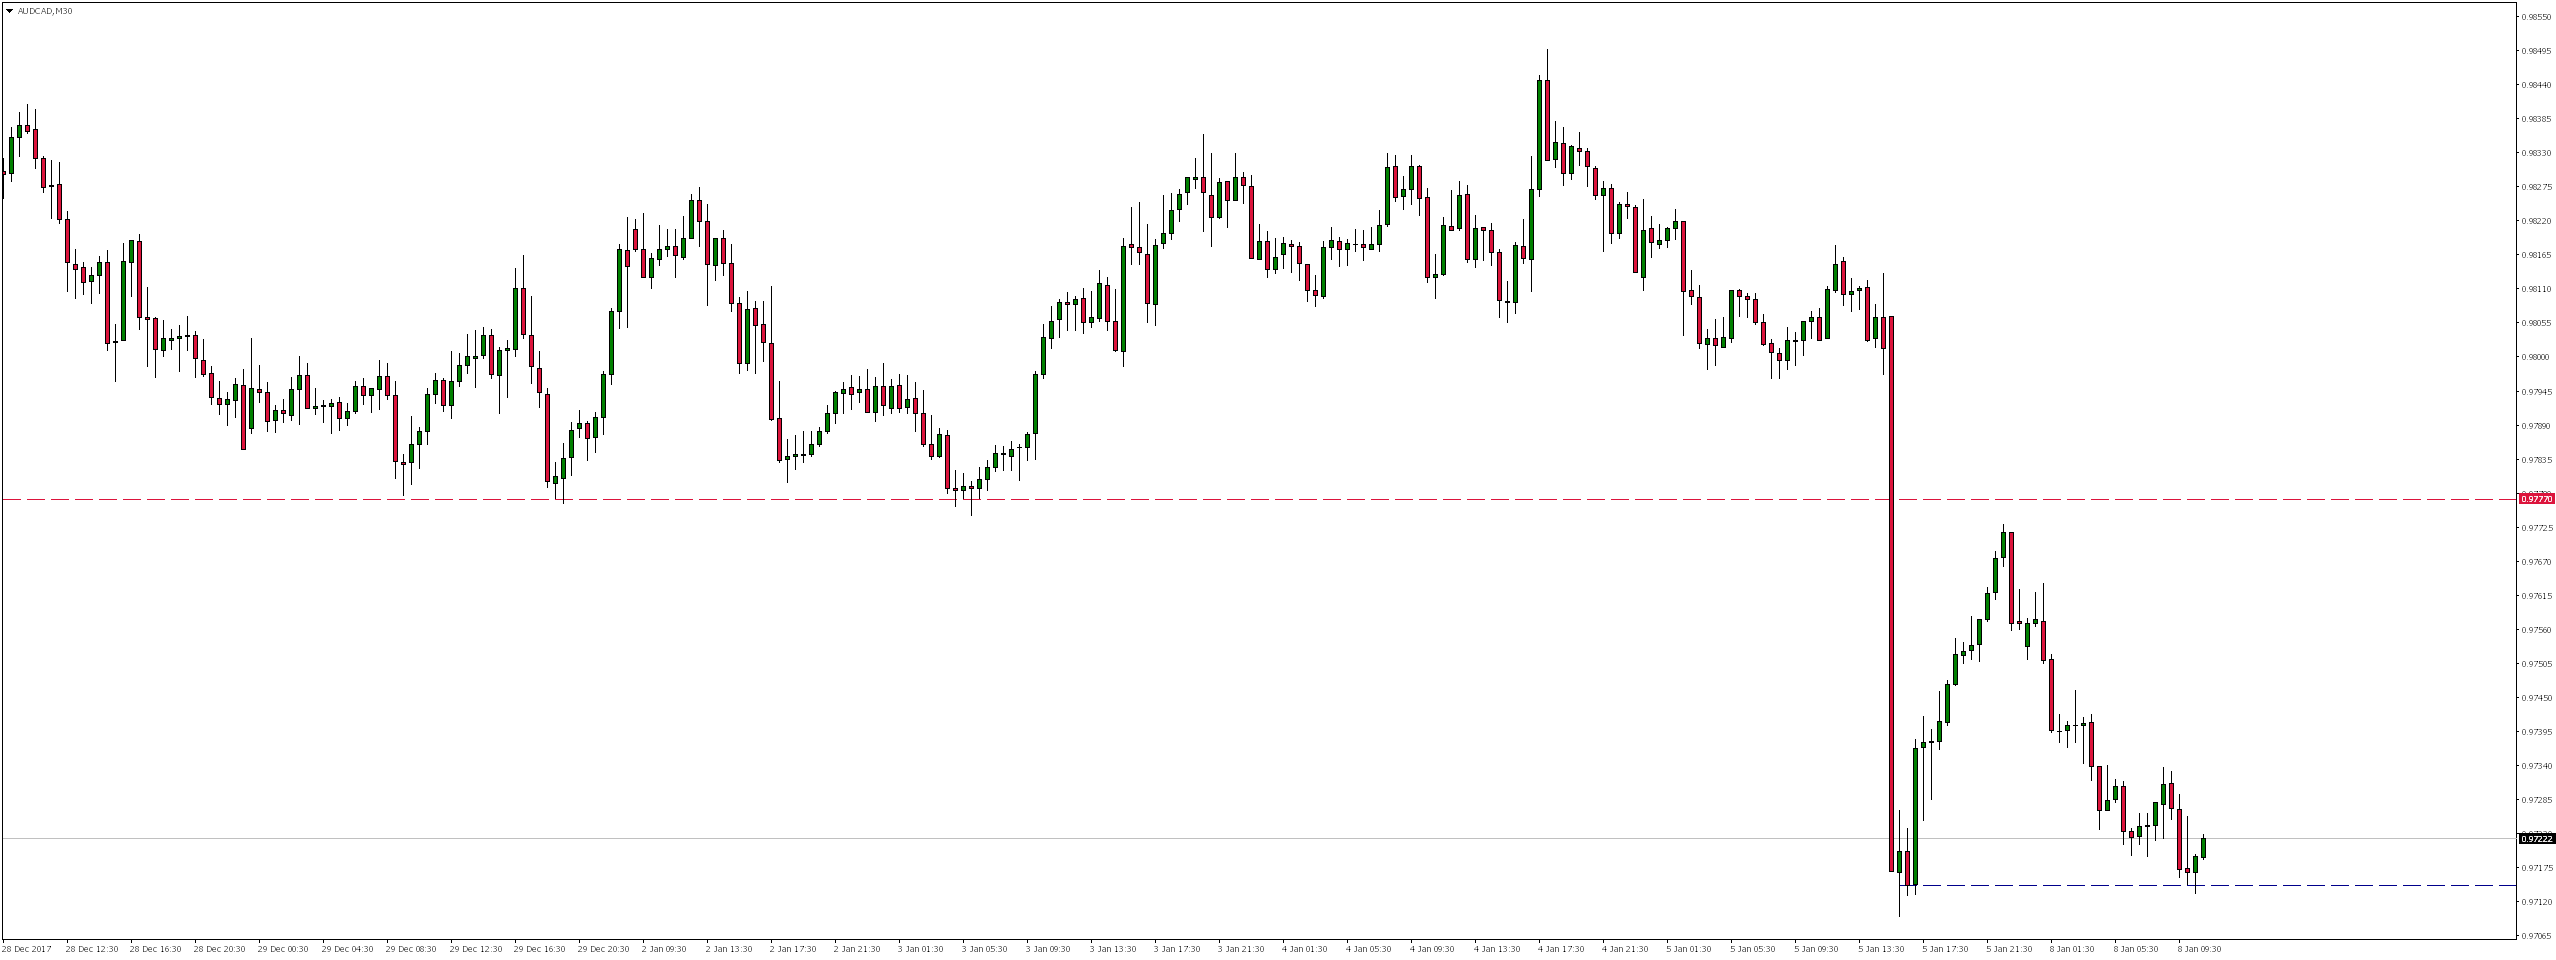
Continuation of declines may also be supported by the fact that due to very strong Friday’s supply reaction caused by compiling weak readings regarding employment changes in non-farm sectors in the United States and the lowest unemployment rate in Canada, the course has beaten local support around 0.9777.
As a result of later increases we saw a correction, and although there was no precise re-test of this support (now resistance), just before the end of the Friday session, a strong supply reaction appeared in its vicinity.
We are currently in the area of Friday’s lows, where a demand response occurred. However, it is not as strong as on Friday, which is why I expect that this support will soon be broken.


 Review")


