GBPAUD – Bearish Engulfing and false breakout from Inside Bar is a good reason to get interested in this pair in the coming days, especially since this is happening at a fairly important level.
A few days ago I wrote about this pair forming Inside Bars, the second of which was entirely within the range of the first one (read more). I wondered how the price would behave – whether the exit from IB would be up or down. It turned out that a bullish scenario had occurred and the pair after leaving the smaller IB went up nearly 400 pips towards the nearest resistance.
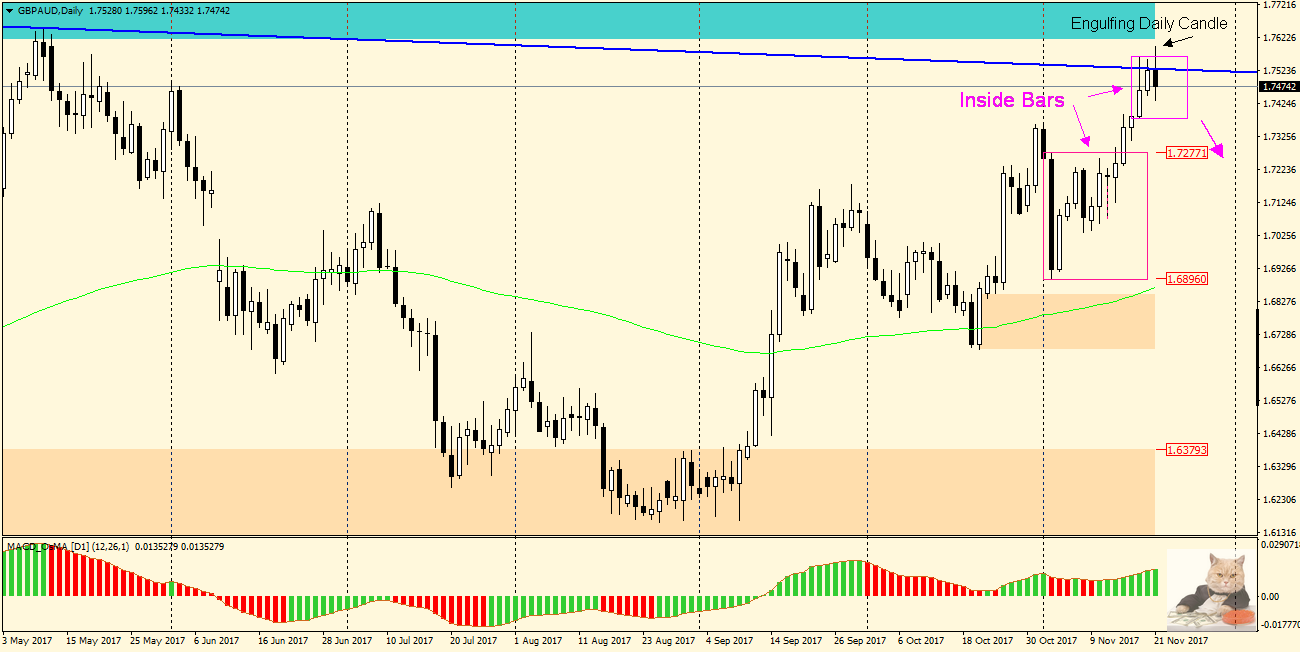
Currently GBPAUD pair reached the supply zone and slightly penetrated the downward trend line extended from 15.09.2016 and 10.05 this year and withdrew below this line, signalling the weakening of buyers. Friday (17/11) candle created Inside Bar, which today was falsely broke out, and additionally today’s daily candle includes yesterday’s creating a Price Action formation – Bearish Engulfing.

Worth noting is that we had similar layout on 10th May , where we also dealt with the Bearing Engulfing, which started the dynamic decline lasting several months, which gave over 1500 pips.
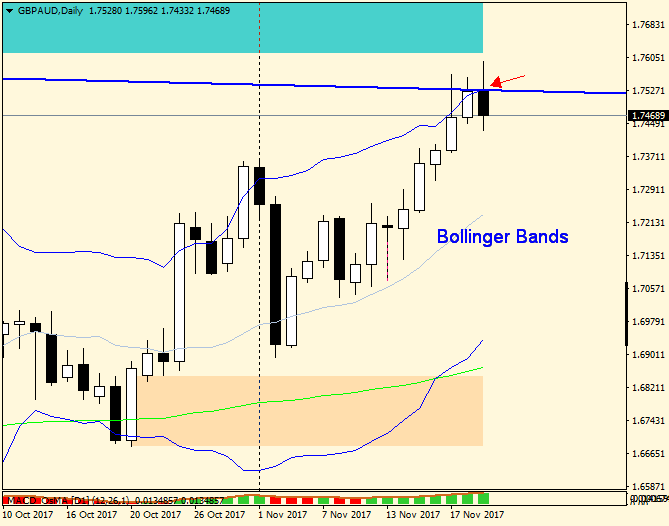
About this formation I wrote recently here. Looking for additional confirmation of the strength of this formation (as in the mentioned article) we can use the Bollinger Bands indicator. We can see that the engulfing candle has its maximum above the upper band, that confirms the formation as strong and encourages us to place Sell orders. The expected range of declines is support at the last high – 1.7360 and further the upper limit of recently leaved IB – 1.7280.


 Review")


