Trading Inside Bars –under this heading you will find analysis made on basis of one of the most known Price Action formation – Inside Bar. Statistics show that best results gives breakout from Inside Bar formation on Daily chart, so mainly this time frame charts will be analysed.
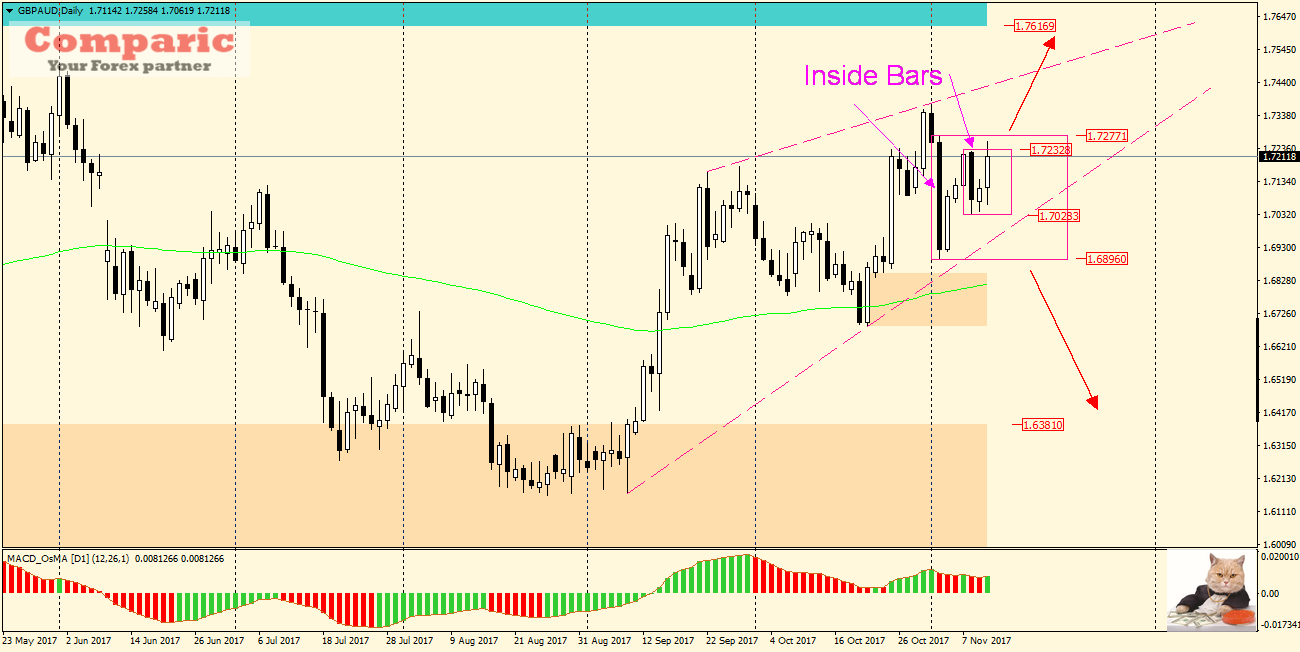
GBPAUD on the daily chart has recently formed two Inside Bars, where the second with a range of 200 pips is included in the first (380 pips), marked with rectangles on the attached chart. The situation is interesting due to fact that on Friday there was a breakout out from the smaller IB, but because the daily candle closed below the upper limit – was formed a “false breakout” formation. Normally, such unsuccessful breakouts signals bearish move. However, given the general uptrend, I would be cautious when deciding whether to open the sell order, it will be more appropriate to wait for confirmation in the form of a successful breakdown from IB. (1.7030). Despite the lack of clear direction, the pair is worth attention in the coming week due to the great volatility offering many pips in short time.


 Review")


