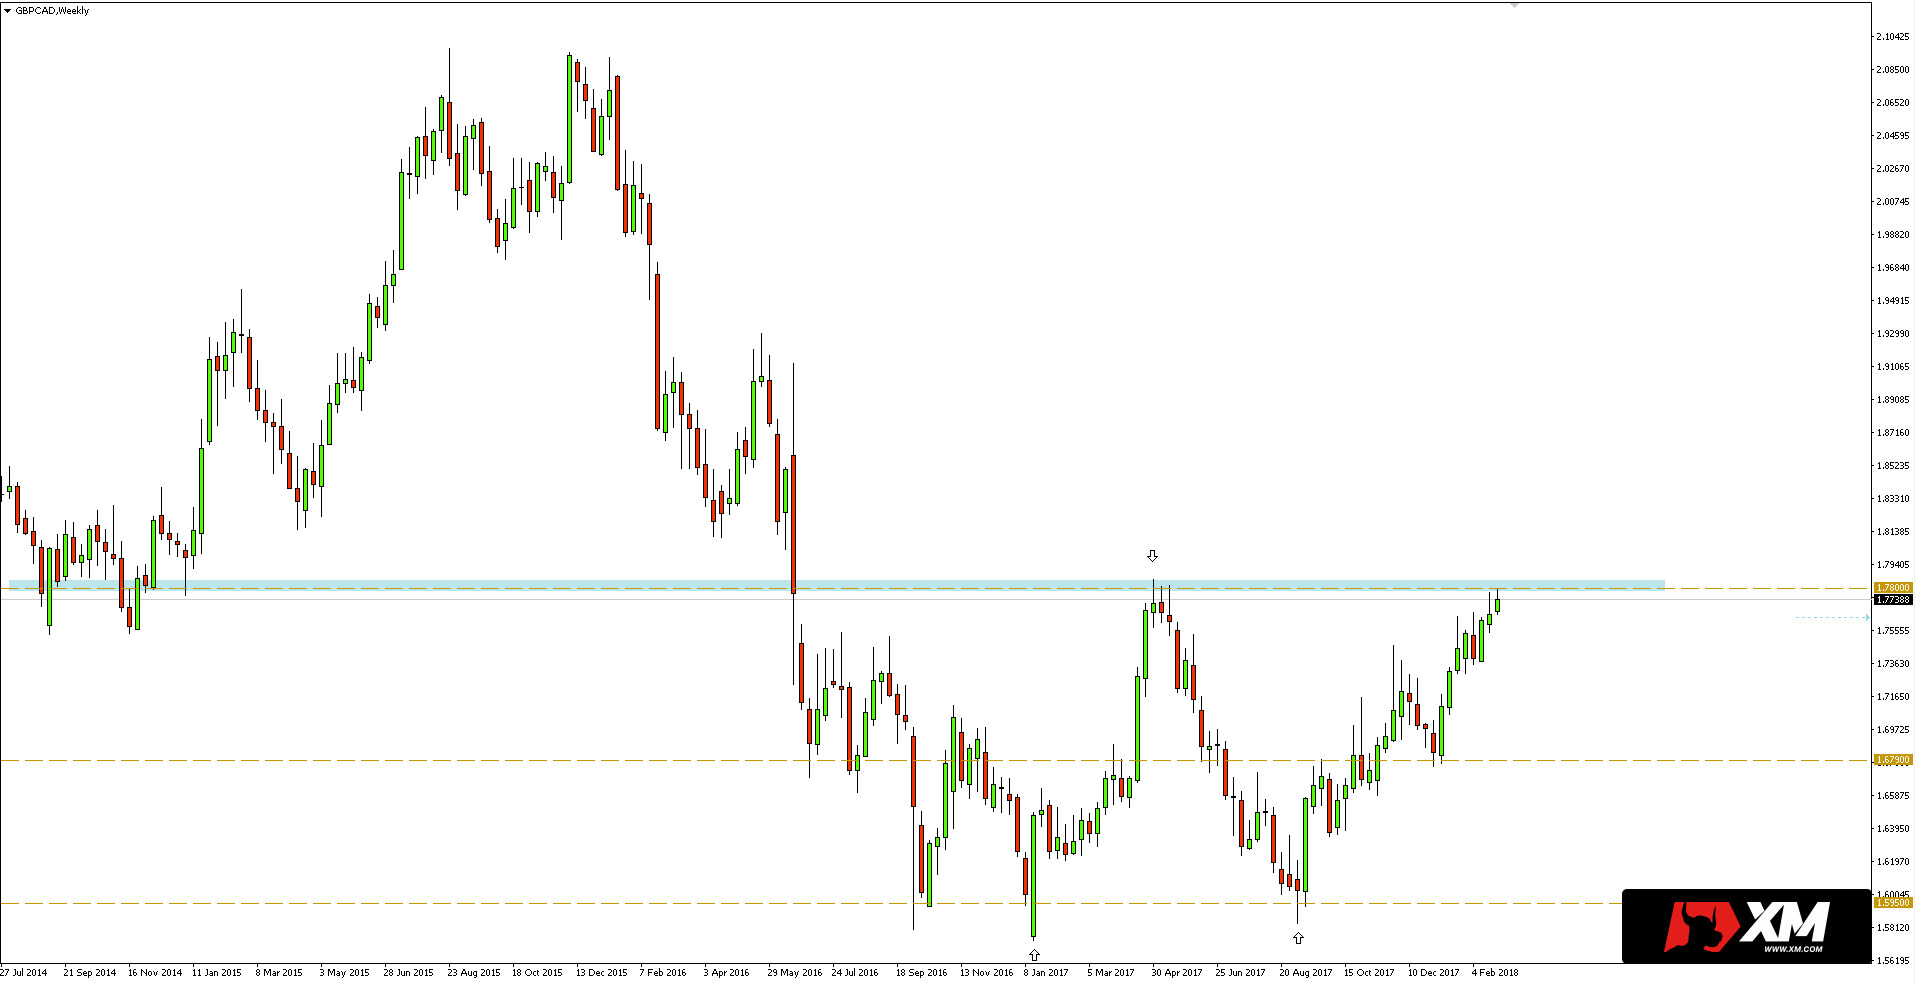
GBPCAD was in a technically interesting place. As you can see in the weekly chart below, price reached the key resistance zone of 1.7800.
The last time, when this level was tested, there was a significant sell of, where support was achieved at 1.5950. The zone at 1.78 was also previously active as support, in the second half of 2014 and at the beginning of 2015.
 It is possible that this time the zone will work as resistance. We can look for a sign of potential weakening of growth in the 4-hour chart. There was also a divergence between the price on the chart and the RSI indications (14), because the higher highs determined by the price do not coincide with those drawn by the indicator.
Bearing in mind the above, it may turn out that there will be a rebound. However, it is worth waiting for additional confirmation, even in the form of effective breaking out of support at 1.7630.

If the above scenario is implemented, the rate may go down to support at 1.7365. Another significant level can be found near 1.7080.


 Review")


