GBPUSD – after reaching maximum in mid-April at 1.4375, it moved in a downward trend and losing 1325 pips reached the minimum of 1.3050 this year. Since the beginning of this month, corrective movements have been underway. I wrote about them in the analysis of July 4. Bullish candle from June 29, with a range of 150p, formed Inside Bar formation, and it took one week for the price to clearly leave this IB. What’s more, the daily candle from Friday engulfed the Thursday, creating a bullish formation, which is a pro-growth signal. The upward divergence between the MACD and the price is still ongoing.
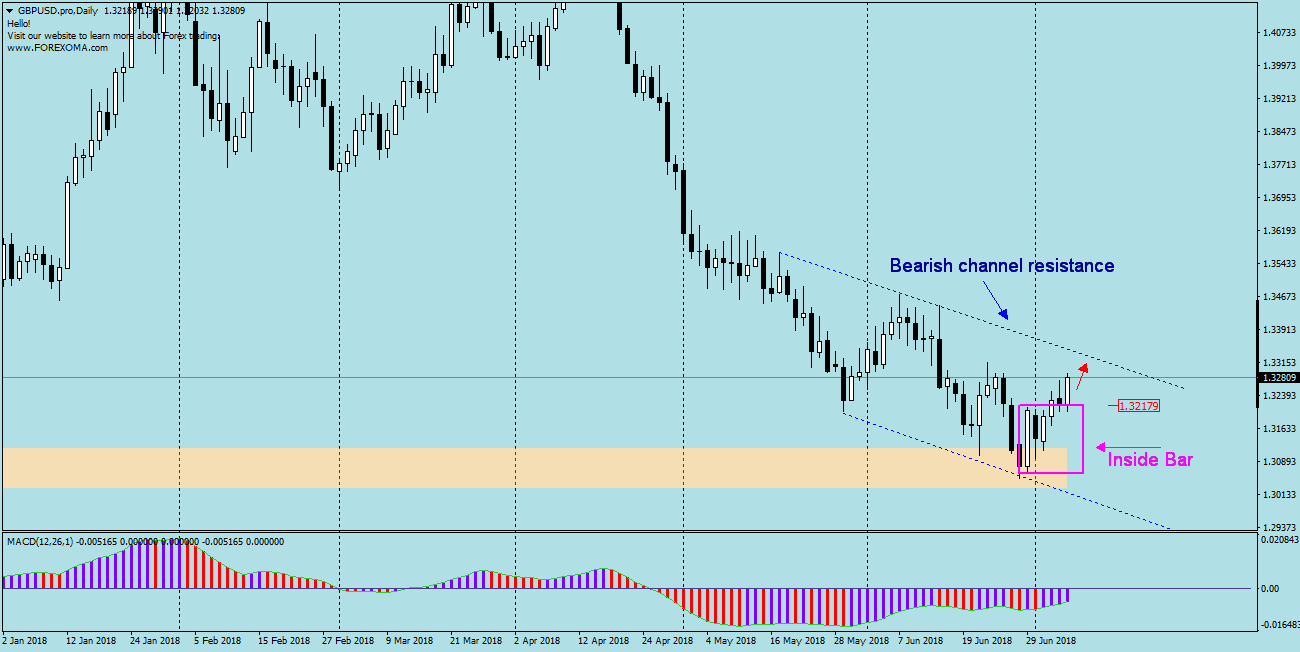
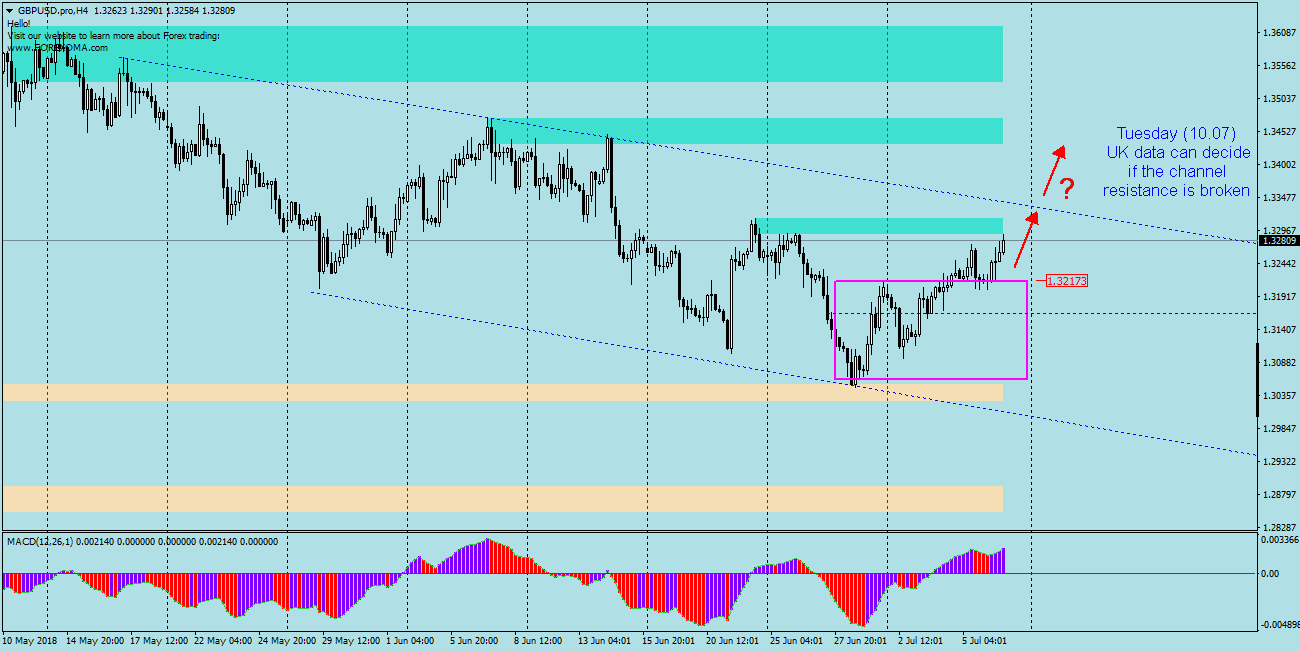
Quotations are approaching the upper limit (resistance) of the bearish channel, in which the pair moves from mid-May. There is a high probability that the price will strive for this resistance currently distant by about 40 pips. It is difficult to predict if it will be overcome, on Tuesday we have important macro data from the UK, so maybe the situation will clear up after this data. In the case of overcoming the aforementioned level, we can expect that the price will reach another resistance, which is around 1.3420, which is better seen on chart H4.


 Review")


