I analyzed GBPUSD two days ago, pointing to Double Top Price Action formation and subsequent declines. Today, it is worth paying attention to the next formation created on the chart. GBPUSD is currently in an Inside Bar formation created by a nearly 100p candle from 04.05 and its range is the zone between 1.3585-1.3485. It is true that yesterday there was an attempt to break in the morning – up and in the afternoon – down, but ended in failure, because the quotes closed back in its range at 1.3545. When trying to break down, the upward trend line from the minimum of June 2017 (blue dotted) has stood in the way.
It seems that another attempt to break out from the formation will ultimately indicate the further direction for this pair. In the case of breakout thru the top, the nearest resistance zone is (marked on the chart in white) the area from which on 1st of March there was a strong reflection leading to the establishment of the maximum this year. In the case of bottoming from IB, the price may go towards the nearest support level of 1.3300.
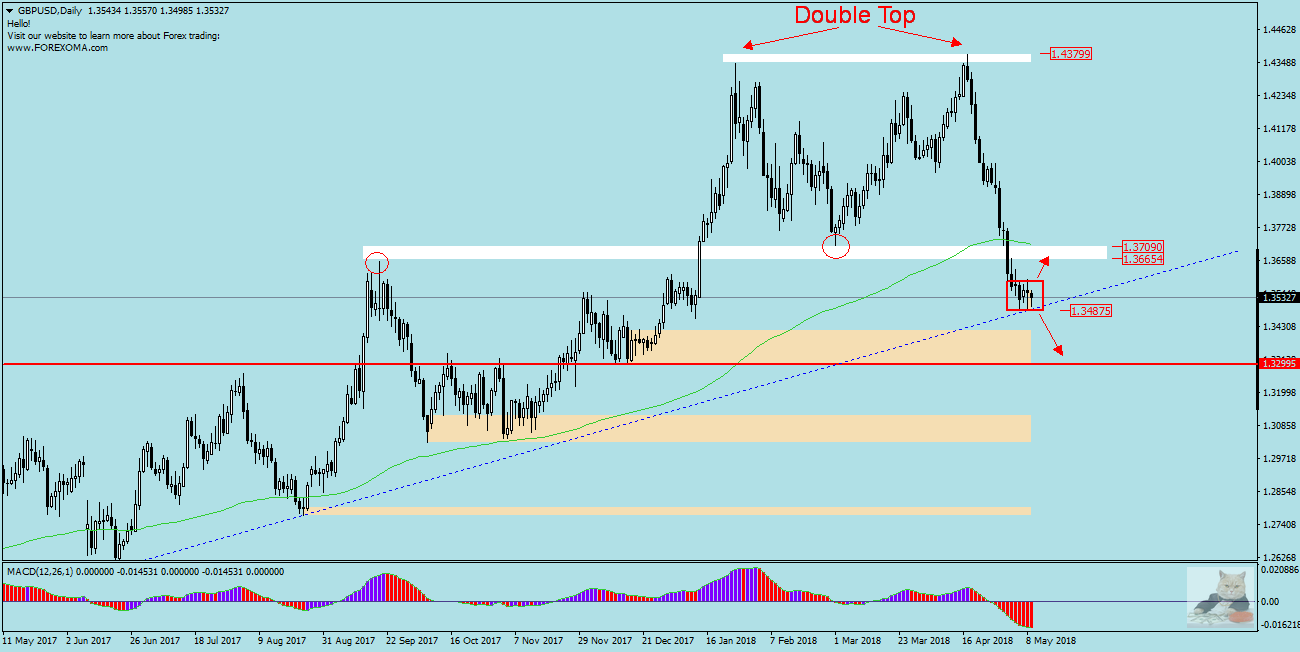
It is also worth observing the indications of the MACD oscillator, if it started to grow, it could be a signal to change the mood and return of bulls to the market. Let’s also remember that tomorrow the BoE decisions on interest rates will surely result in greater volatility in pairs with the pound.


 Review")


