Trading based on harmonic formations mostly depends on proper measurement of Fibonacci retracement in relation to price movements.
A description of all the patterns can be found in the article: Harmonic Trading – Most Efficient Patterns. Harmonic formations are patterns of continuation of the trend. For this reason, it is important that the movement we expect is consistent with earlier trend. The most effective is the formation, whose point D falls on significant support/resistance.
Growth Gartley on AUDUSD
Even today a harmonic formation has a chance to be formed on AUDUSD. On H1 can be determined a Gartley formation, which in this situation is a bullish formation. At the bottom of this article you will find chart from last week’s BAT formation on AUDCHF, which so far is behaving as planned.

Bullish formation in a strong upward trend
Garley’s formation is the oldest of harmonic formations and next to the AB = CD formation is one of the most effective. Curently on AUDUSD chart further increases will additionally support a strong upward trend.
Garley’s formation on the AUDUSD has been forming for a week. After appearance of XA segment, price has fallen to point B, which is located on the 61.8% abolition of the straight line XA. Then there was bullish movement to the point C, which had to be contained between the straight BC. At this point, we are waiting for the test of 78.6% abolition of the straight XA and next should appear point D at area 0.7915. Bullish reflection that should appear in point D has chance to bring AUDUSD to July highs. However, if D 0.7915 – 0.7910 is broken, then the formation will be negated.
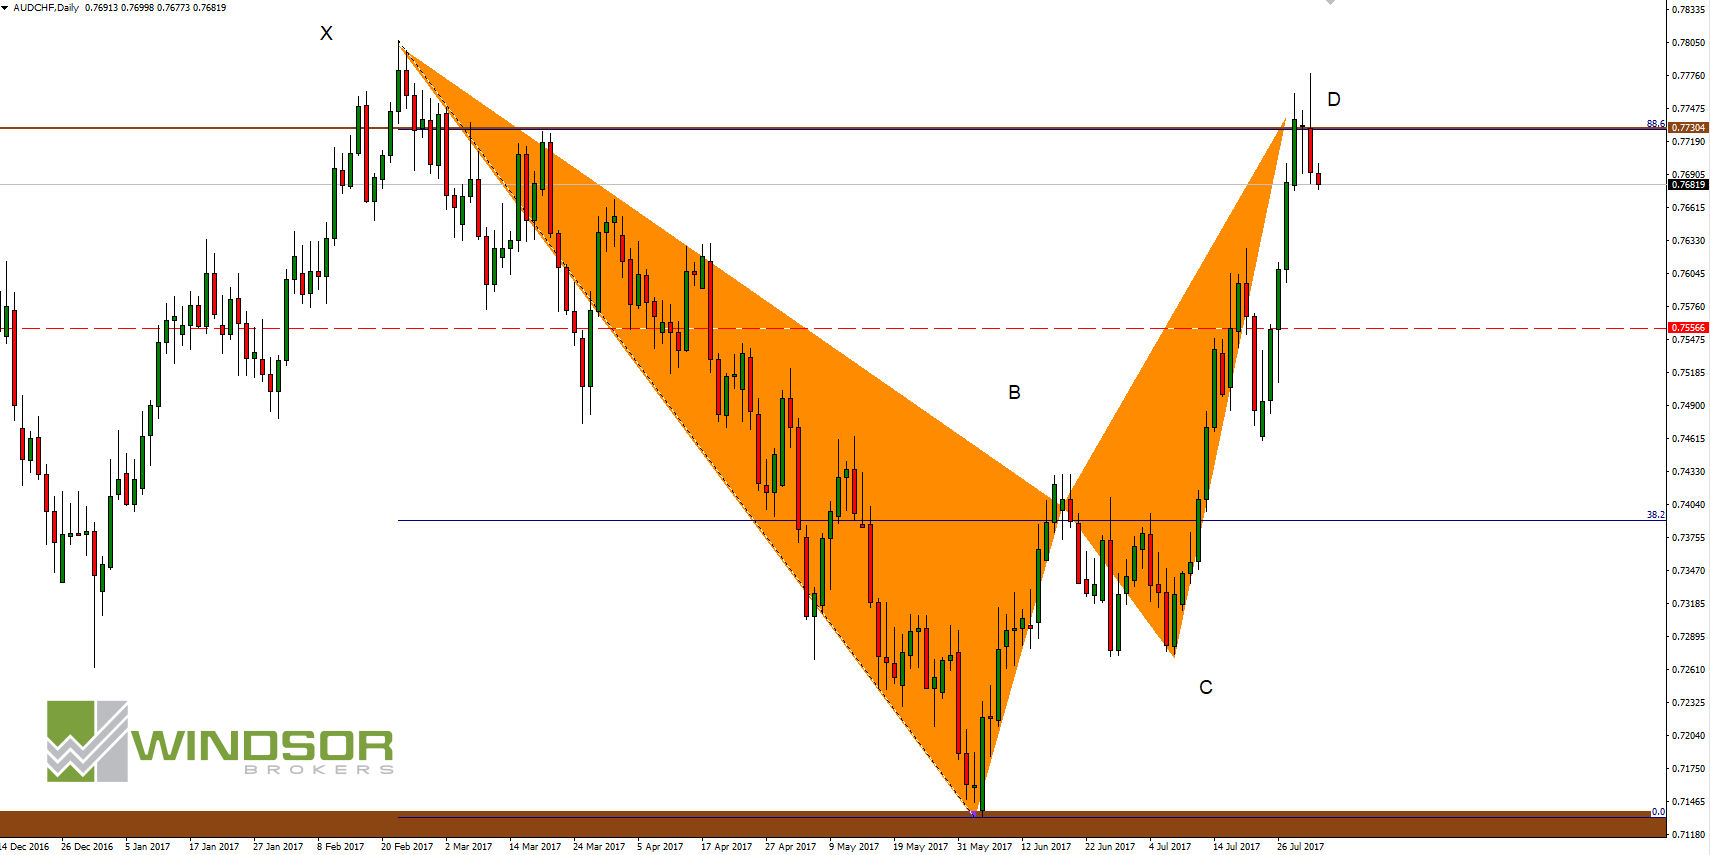
Bearish BAT Formation on AUDCHF
According to last week’s analysis, the BAT formation on AUDCHF has so far acted as expected. Now there may be a downward movement, or a second test of the D point will occur, which is also a common practice.


 Review")


