Trading based on harmonic formations mostly depends on proper measurement of Fibonacci retracement in relation to price movements.
A description of all the patterns can be found in the article: Harmonic Trading – Most Efficient Patterns. Harmonic formations are patterns of continuation of the trend. For this reason, it is important that the movement we expect is consistent with earlier trend. The most effective is the formation, whose point D falls on significant support/resistance.
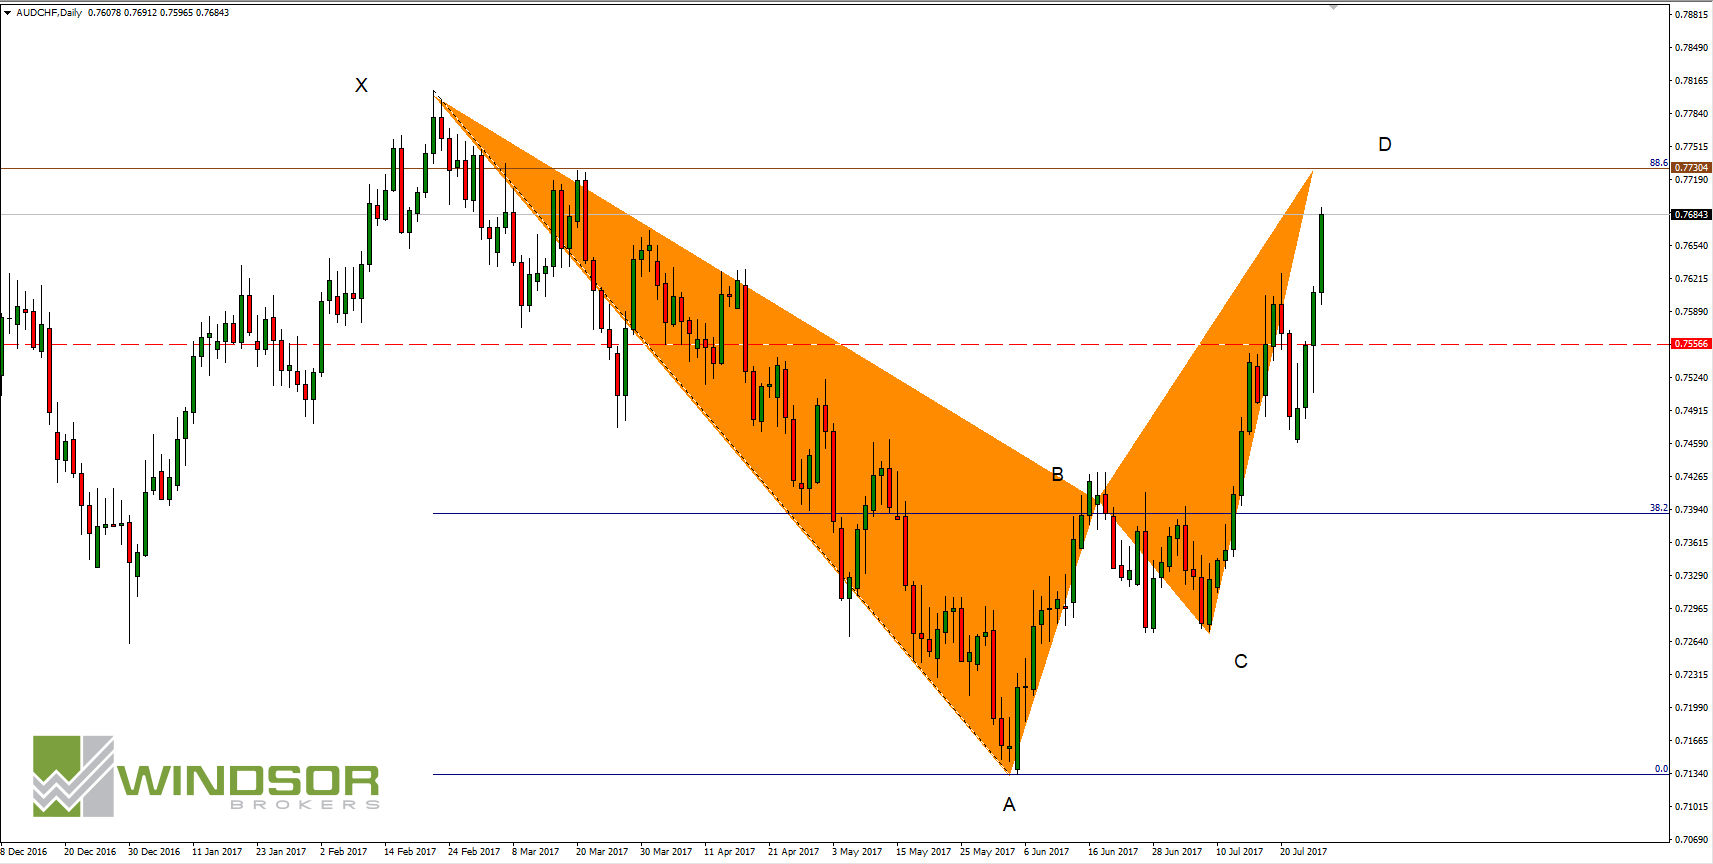
The situation looks very interesting at AUDCHF from the Harmonic Trading point of view. The price reached the top at 0.7806 level on February. From this moment AUDCHF was falling until bottom at 0.7133 was reached. Afterward, the upward movement started and mentioned movement can be described as XA. Now the price should form BAT pattern and it will predict declines at AUDCHF.
Point D of BAT supported by resistance
BAT pattern on AUDCHF isn’t yet fully developed. Despite mentioned XA line also point B is formed in area of 38.2% retracement of XA and point C between BA. Currently we just wait for the test of point D on 88.6% retracement of XA line. It is on the 0.7730. This level was important in 2014-2015 what we can see on the weekly chart. First it was a support, then a resistance (still working). There is less than 50 pips to test this area.
After testing point D we can expect two scenarios. The most probable one is depreciation with strong dynamics lasting to point B of pattern.
YOU CAN START TRADING ON FOREX MARKET USING FREE Windsor Brokers ACCOUNT
Alternative scenario is breaking above point D and negating BAT pattern. This scenario is less likely but it can also happen. If that will happen, there can be some kind of consolidation before breaking point D, and some strong bullish candle after that.


 Review")


