 Ichimoku is an investment strategy of trend following, it works great on H4, D1 and higher time frames. In this series of articles I present my setups and observations using Ichimoku, supports and resistances and Price Action patterns. You can also check previous Ichimoku overview.
CADCHF
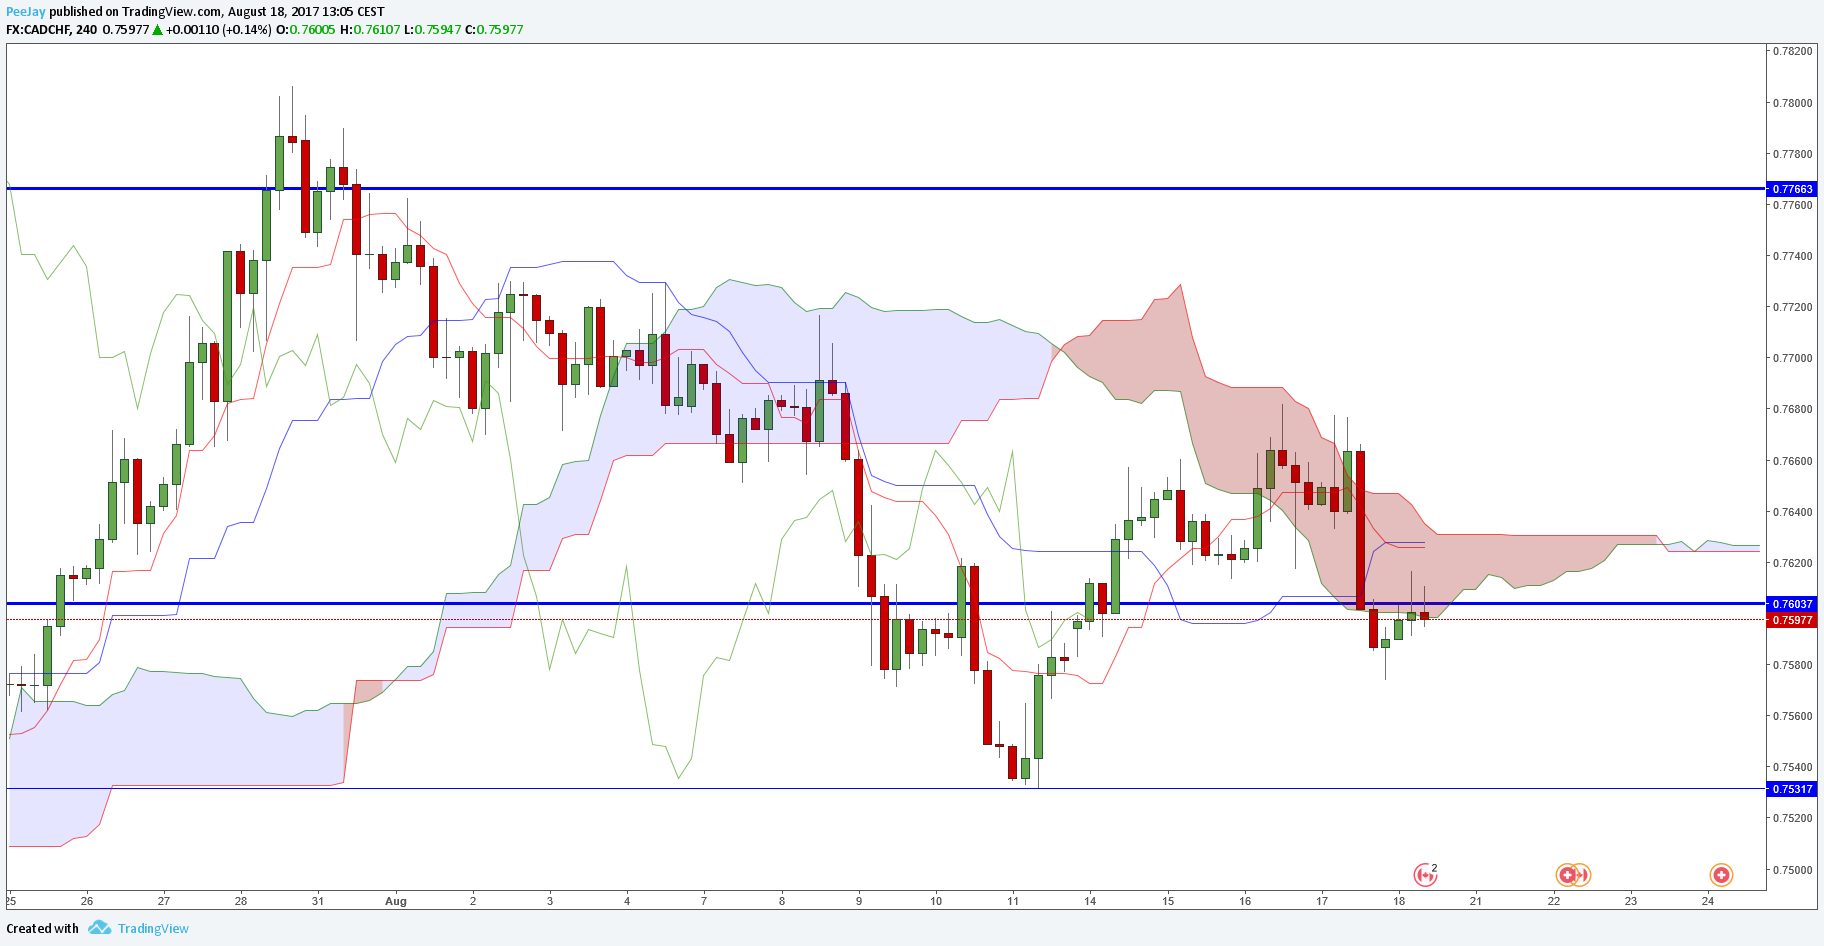
Situation on H4 chart of CADCHF isn’t clear. Since the end of July pair is in bearish trend, however since August 11th there was a strong bullish correction. It ended with huge bearish candle, currently price is near support/resistance from daily chart. Lately this level wasn’t working too good.
If current candle will close below bearish Kumo cloud, we can think about opening short position with the target at support in 0.7530 area – last correction occurred here. This signal is additionally strengthened by current cross of Kijun and Tenkan lines and shape of the candle, which can become a pin bar.
CADJPY
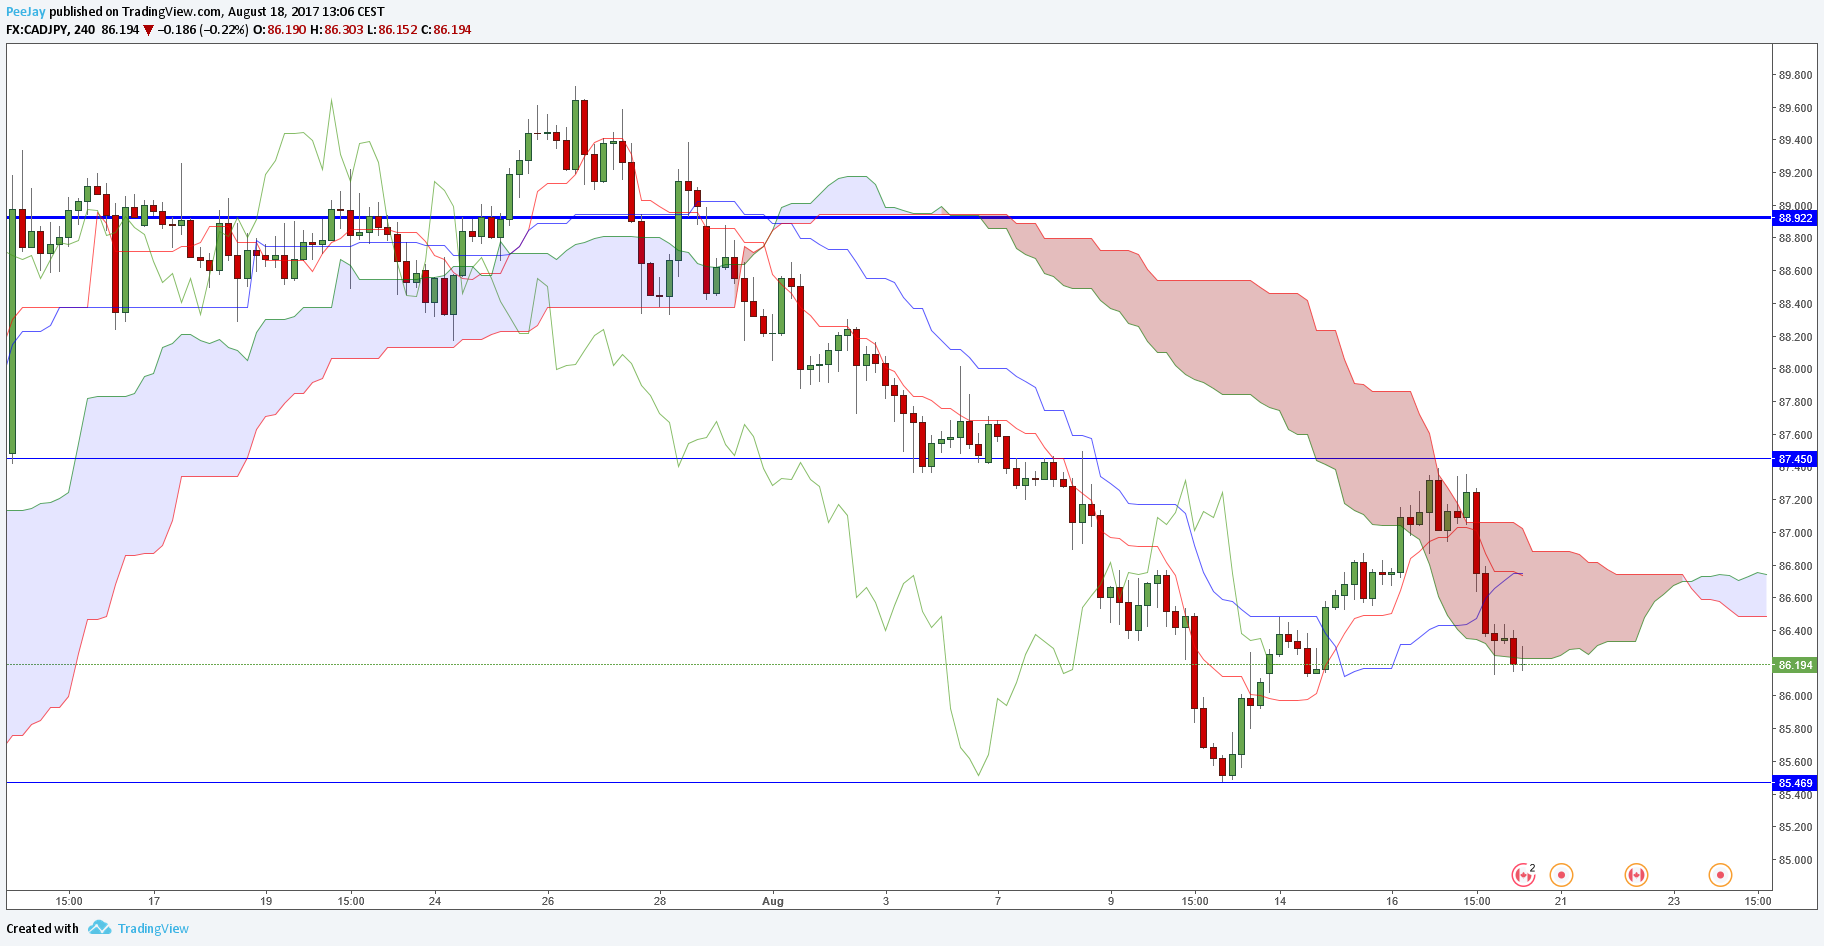
Situation looks similar with CADJPY. First there were strong decreases lasting since the end of July, then there was a bullish correction, and now price can break from bearish Kumo cloud, what is additionally strengthened by Tenkan line crossing Kijun.
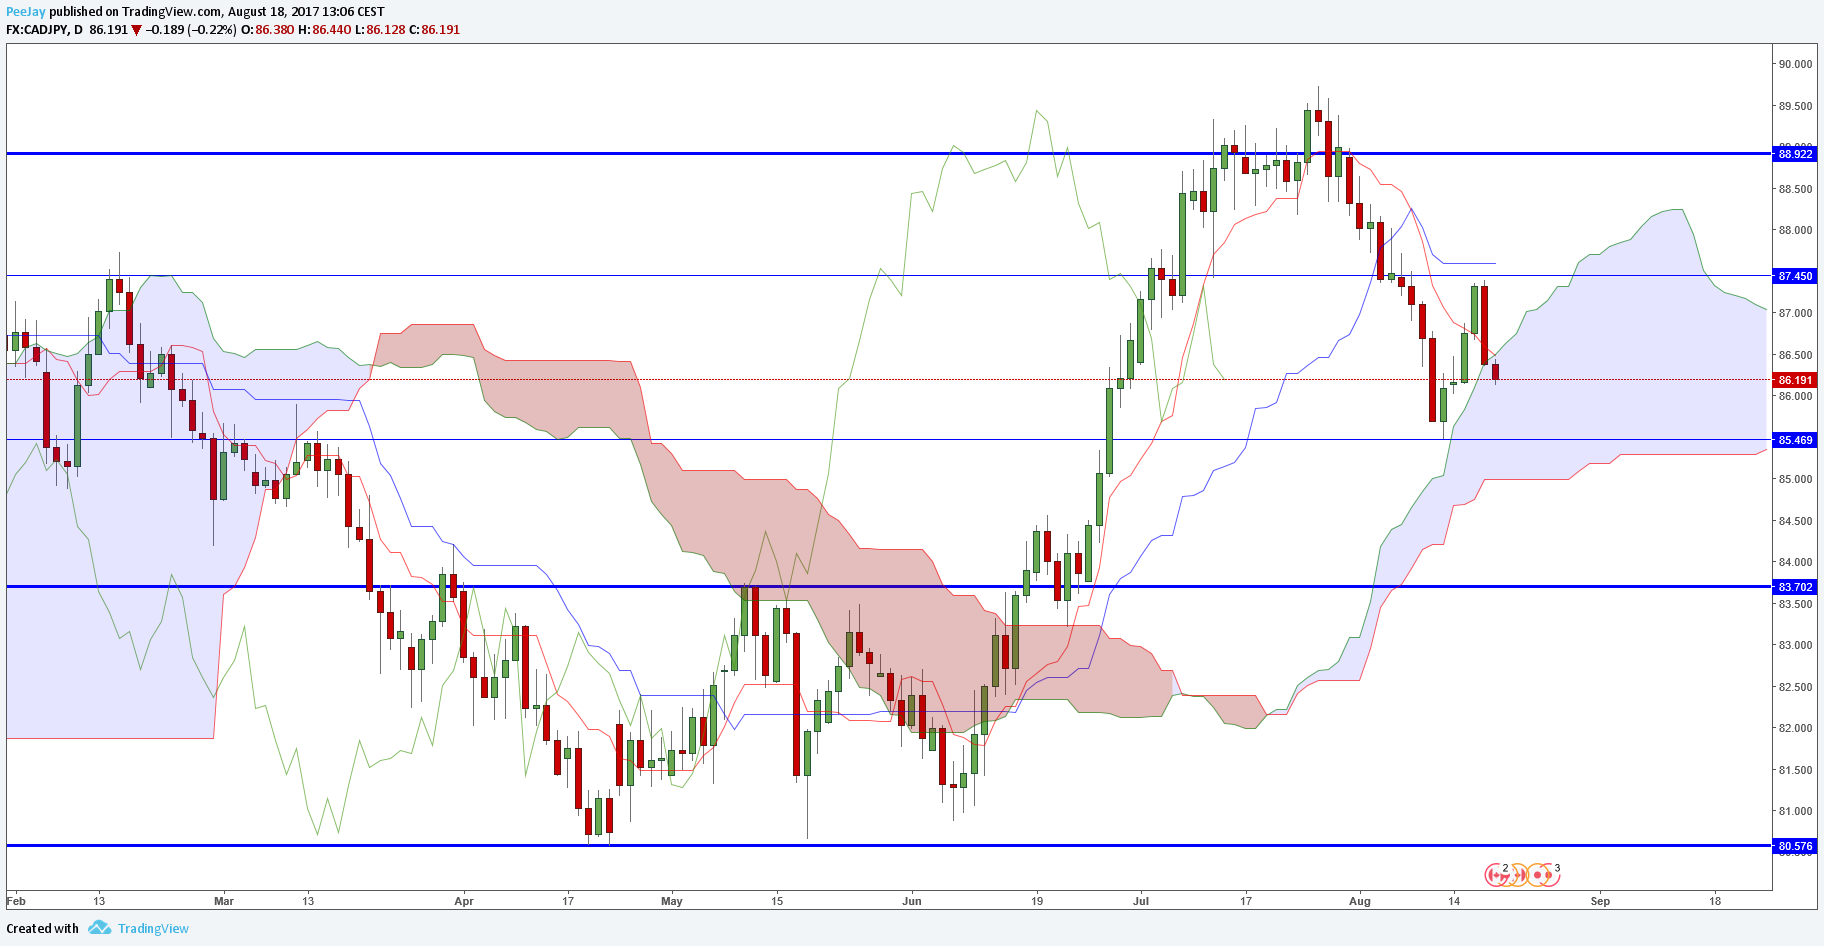
We should consider that on daily chart price just entered really wide bullish Kumo.
EURJPY
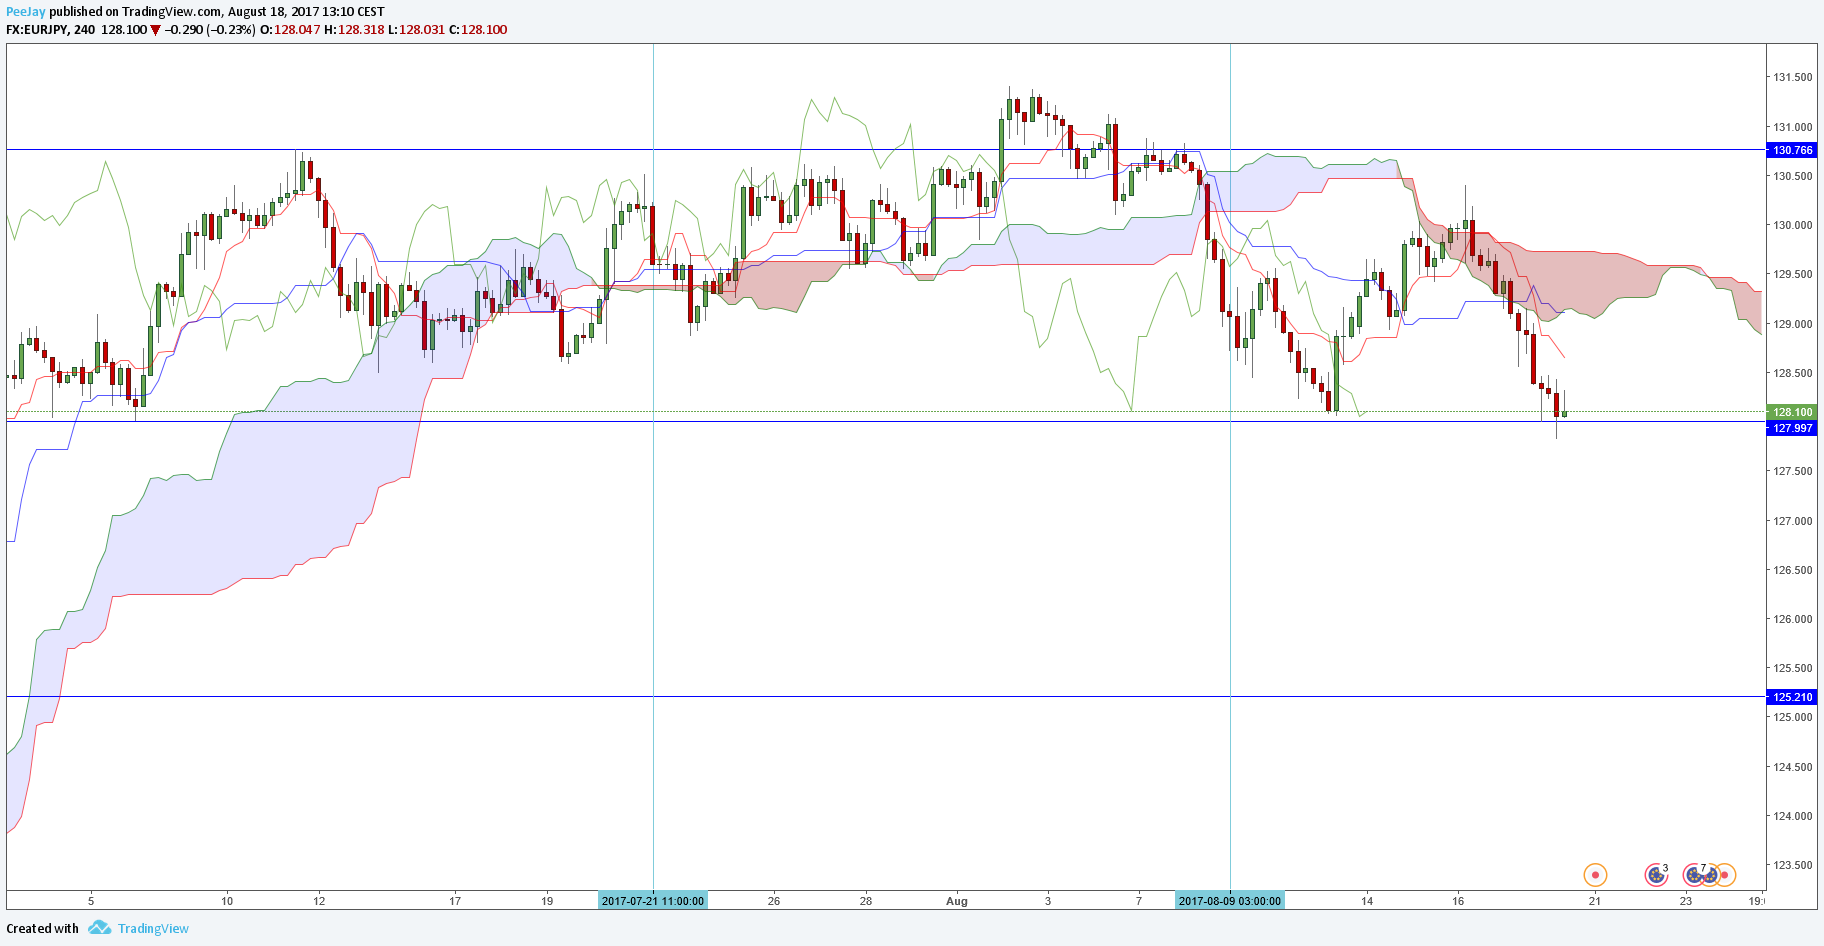
Price is in the consolidation between support at 128.00 and resistance at 130.75 since the end of June. Currently it is for the second time in the last few days close to lower band of side movement. Ichimoku signals indicate depreciation but we should be aware that during consolidation often false signals are generated. This is why I recommend to wait for further development of the situation. If there will be permanent break of the support, we can think about opening short position.


 Review")


