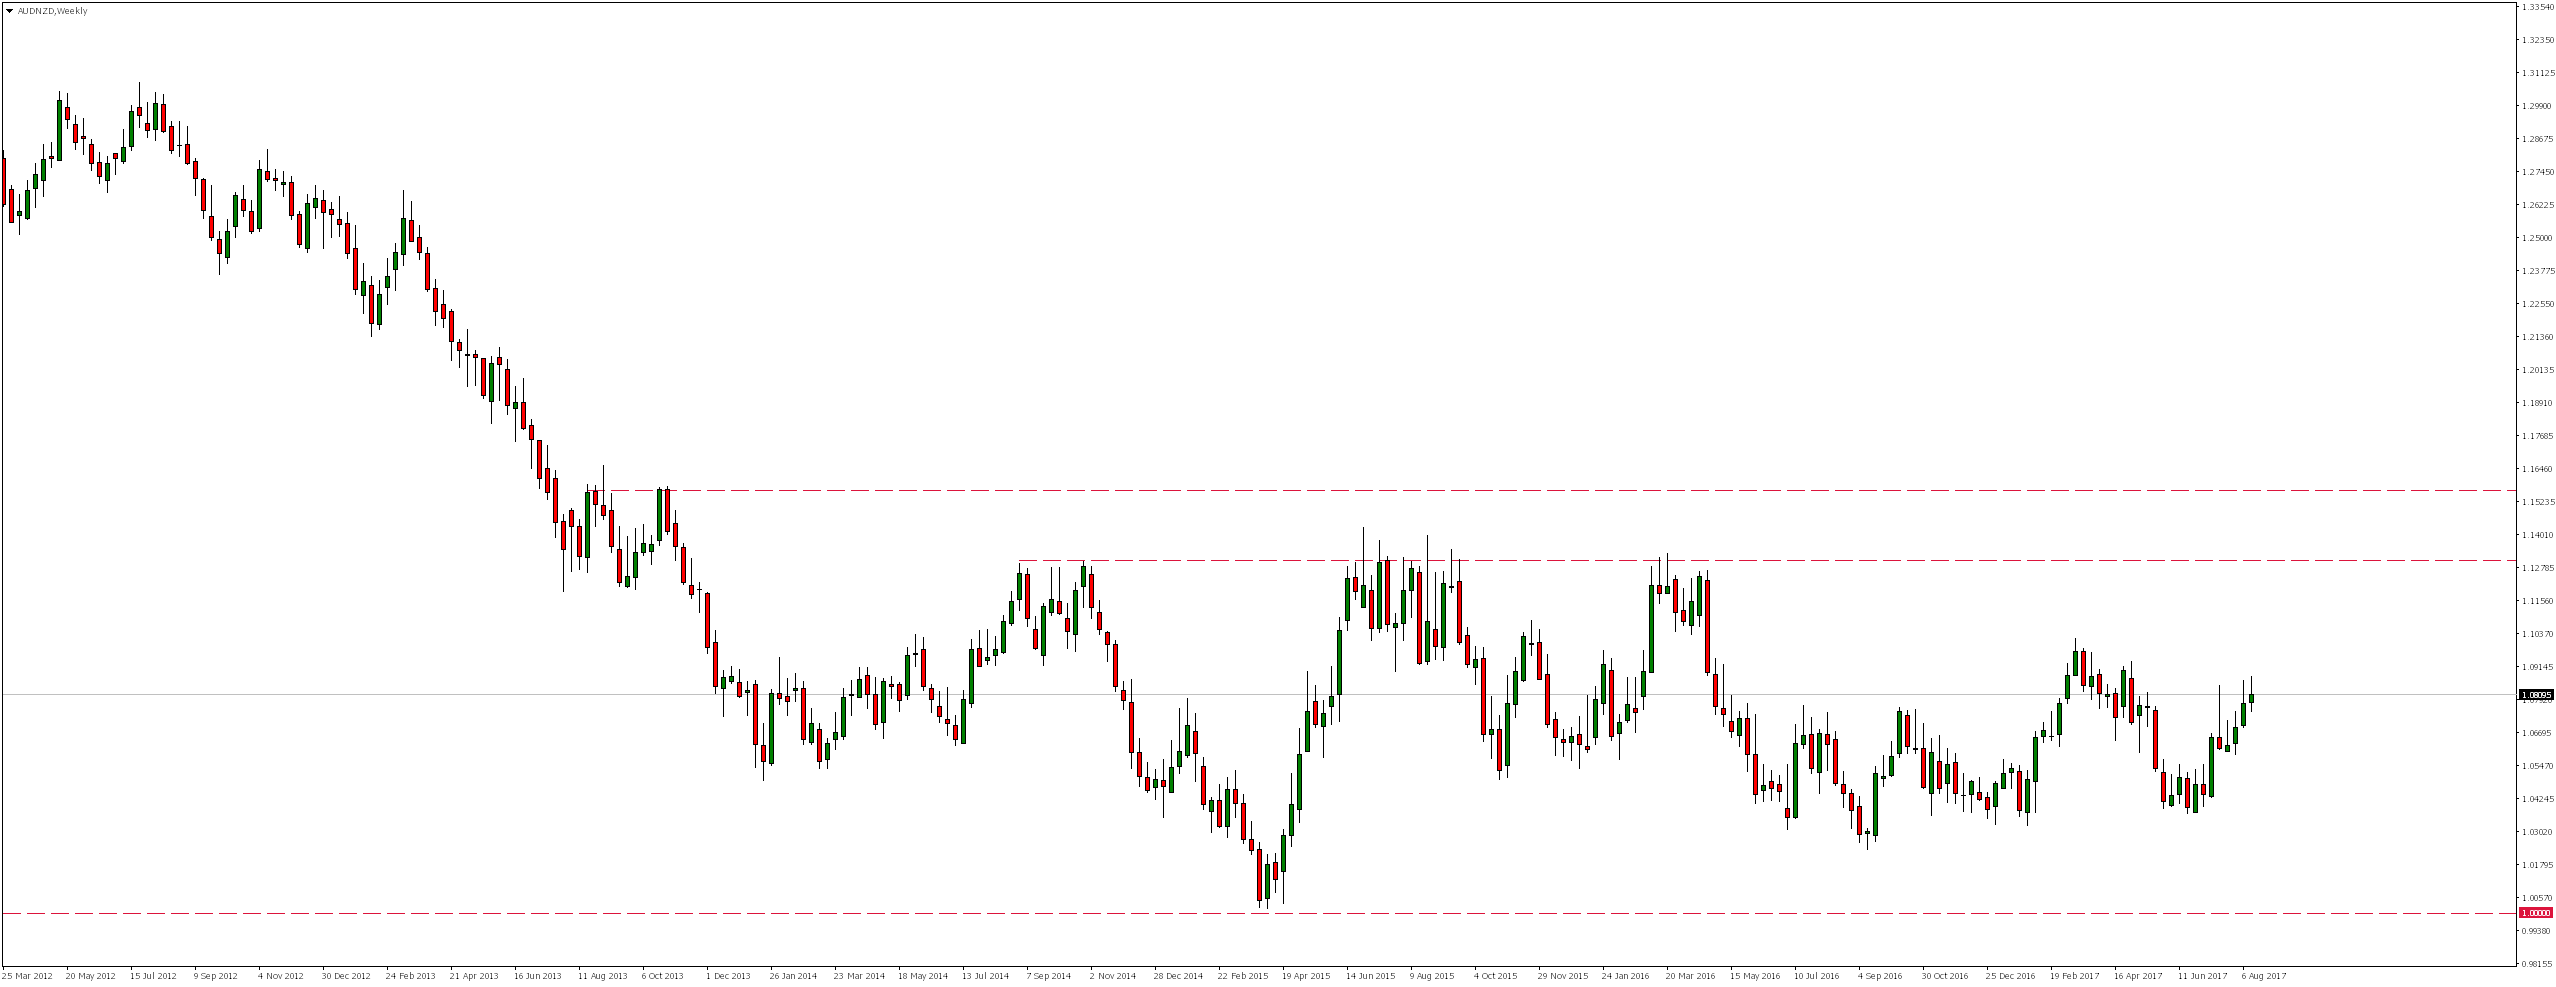
As a result of AUDNZD’s ongoing declines since April 2011, pair reached level around 1.0000, where in April 2015, there was a demand response. Since then, we have seen movement in a horizontal trend (consolidation), which upper limit coincides with a 38.2% Fibonacci correction.
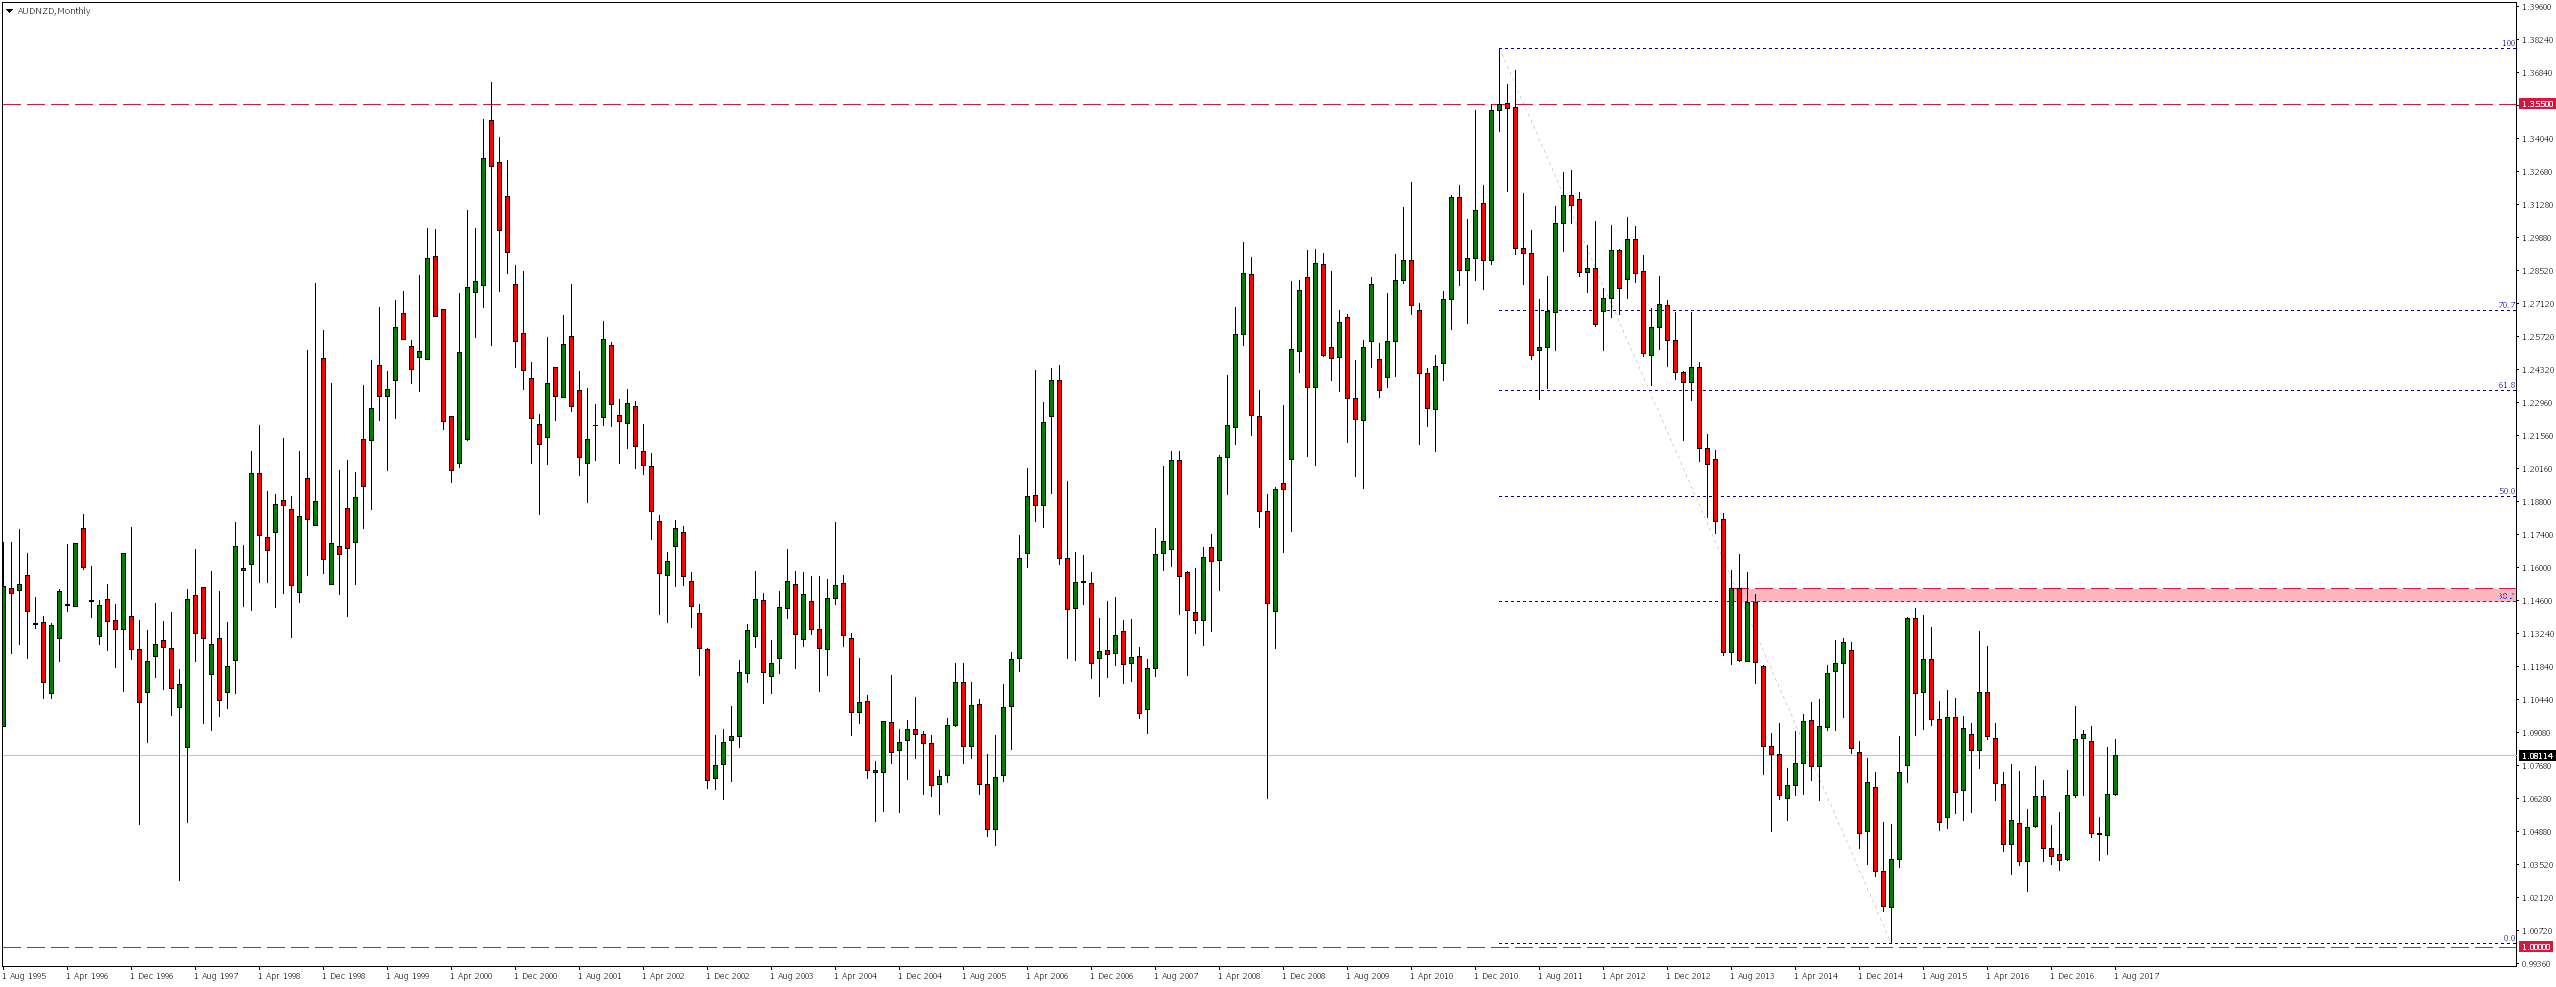
Definitely better than on monthly chart this over 3.5 years consolidation can be seen in the weekly chart.
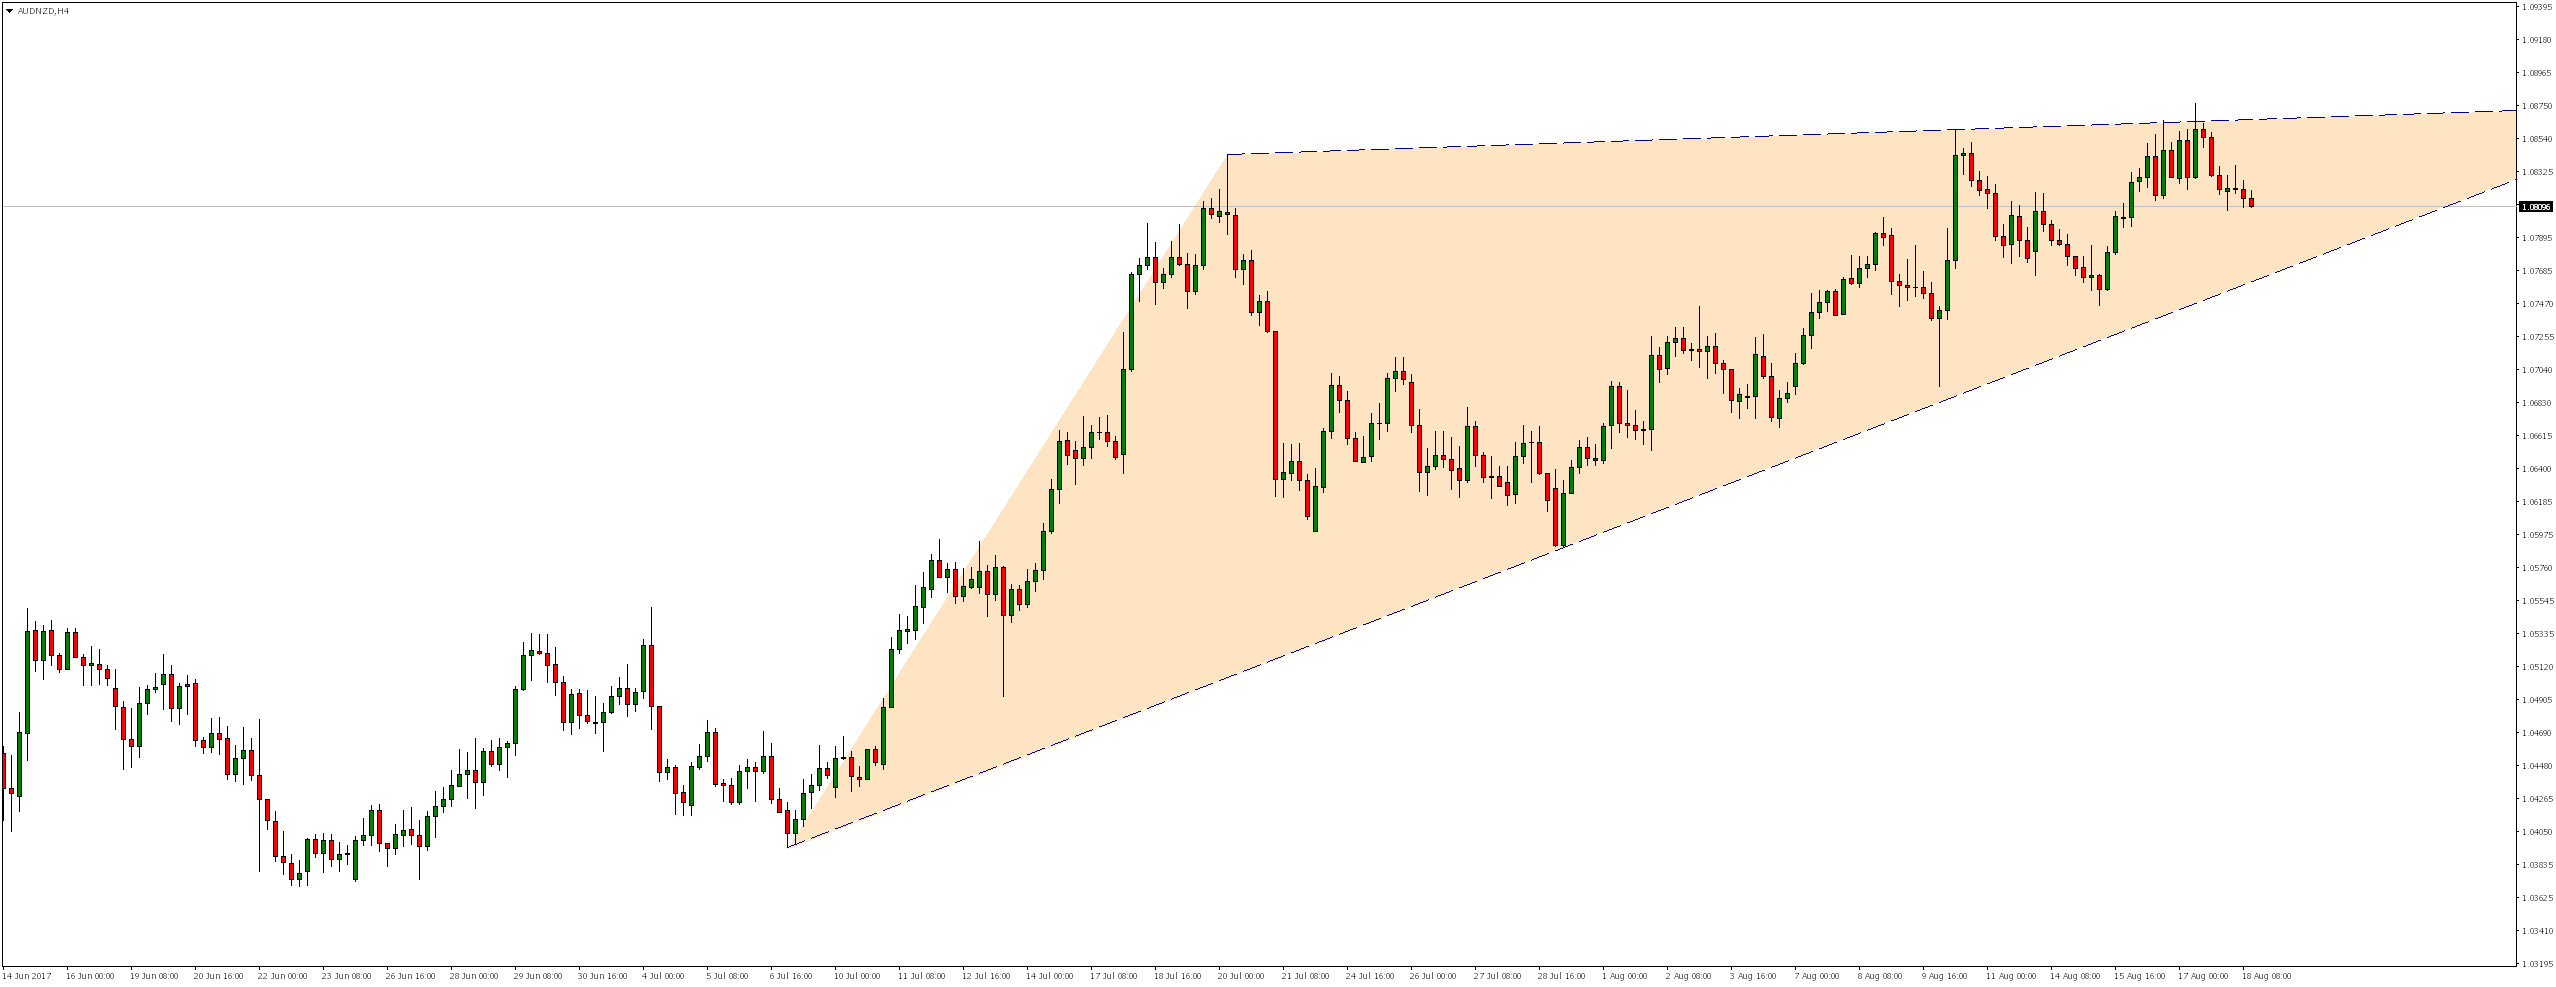
Looking at the H4 chart, we notice that the market is moving to the north forming a wedge formation. As a result of the rejection of the upper limit of this formation, we have seen declines since yesterday.
On the 30-minute chart, we note that as a result of these falls price has reached local support, converging precisely with 50% of the Fibonacci correction from earlier gains, where overnight demand response has occurred. Despite this, the growth did not last long and now we are once again in the area of this level. If support is permanently defeated, we could expect continuation of the decline at least around the lower limit of wedge formation or around Tuesday’s 1.0746.
Error, group does not exist! Check your syntax! (ID: 4)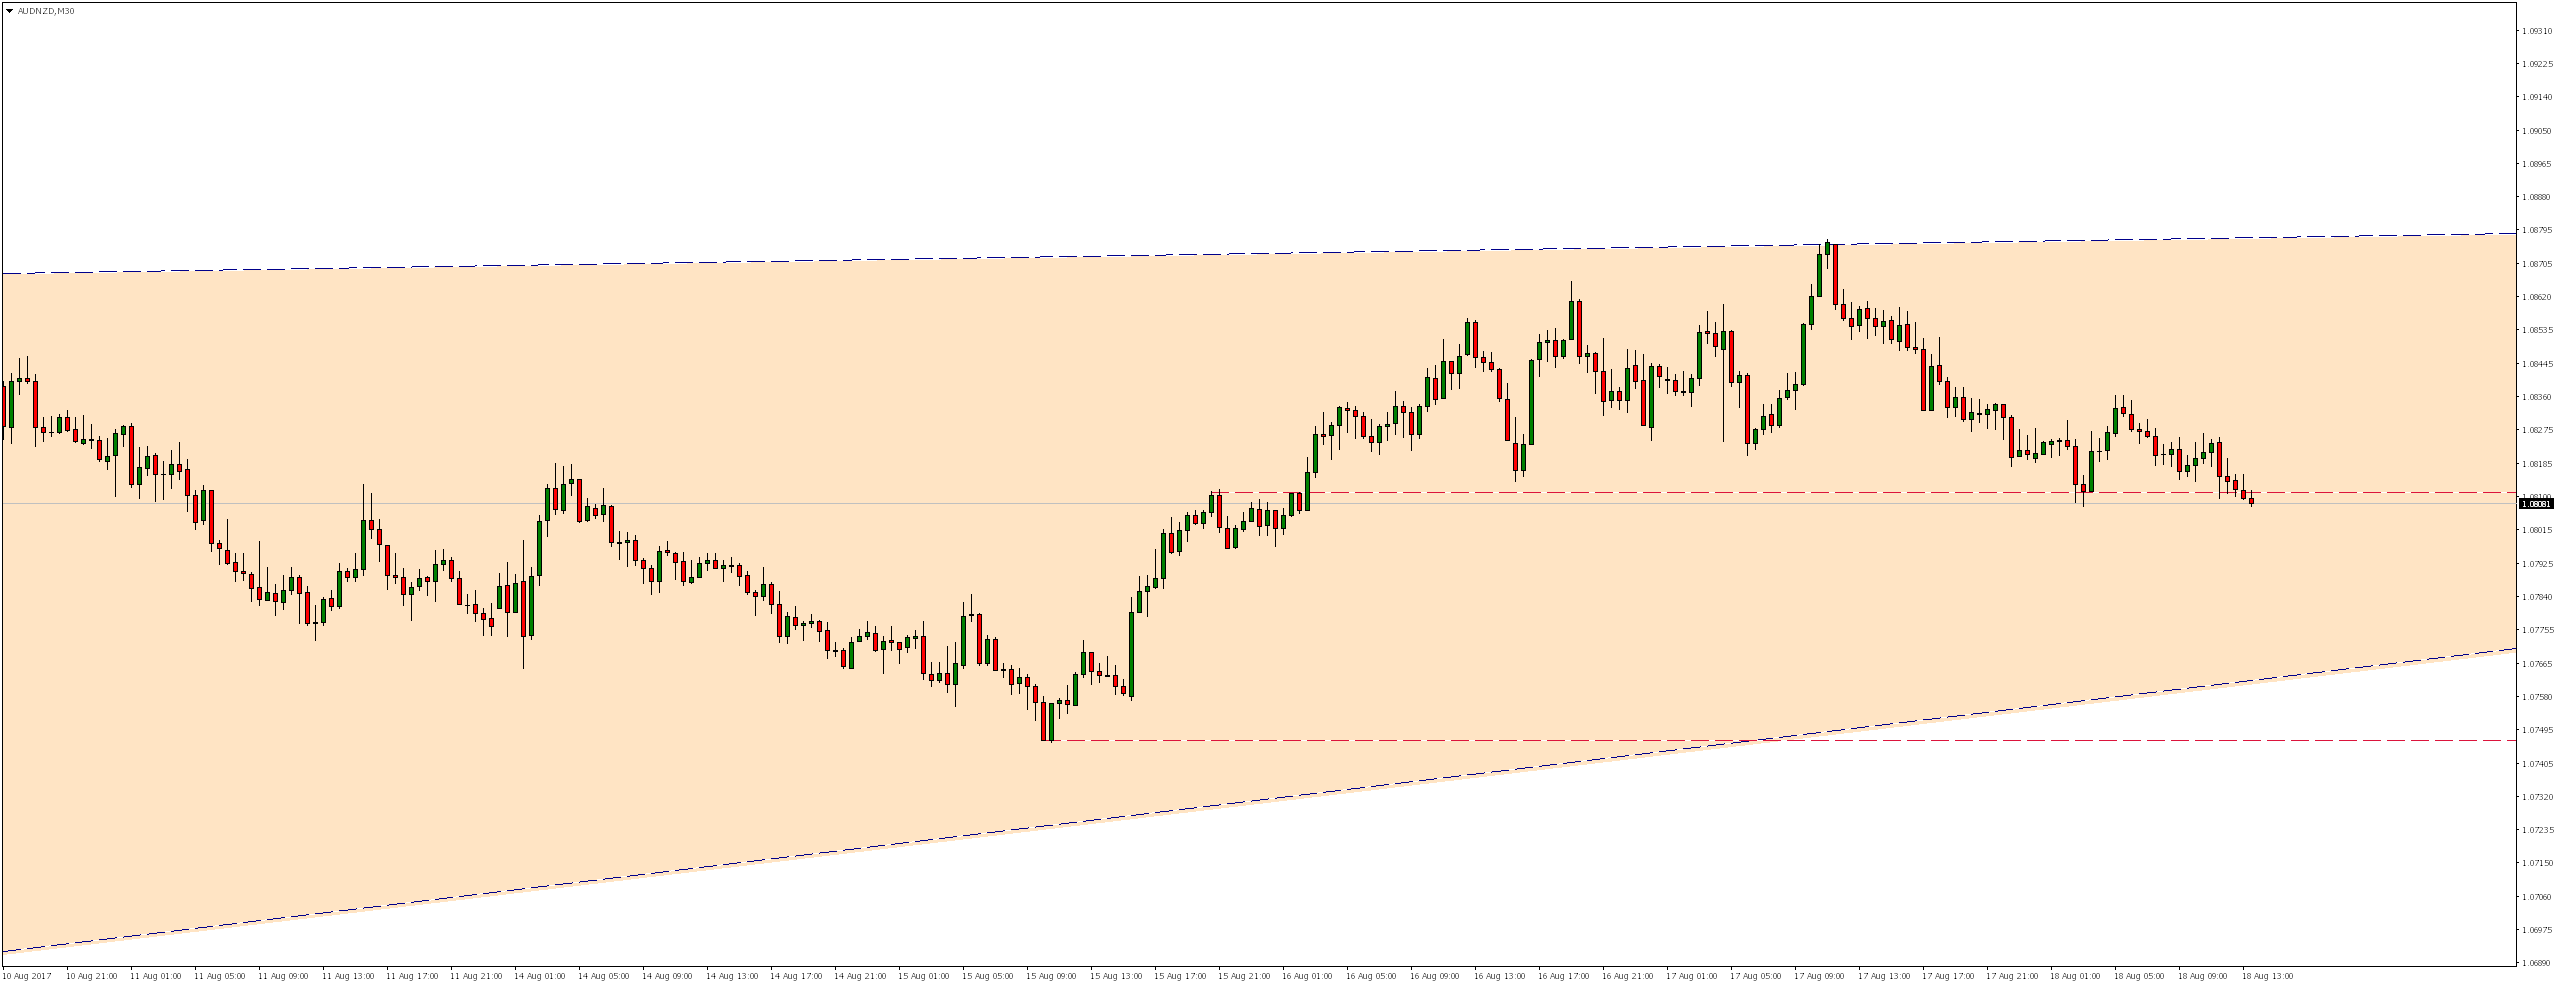


 Review")


