 Ichimoku is an investment strategy of trend following, it works great on H4, D1 and higher time frames. In this series of articles I present my setups and observations using Ichimoku, supports and resistances and Price Action patterns. You can also check previous Ichimoku overview.
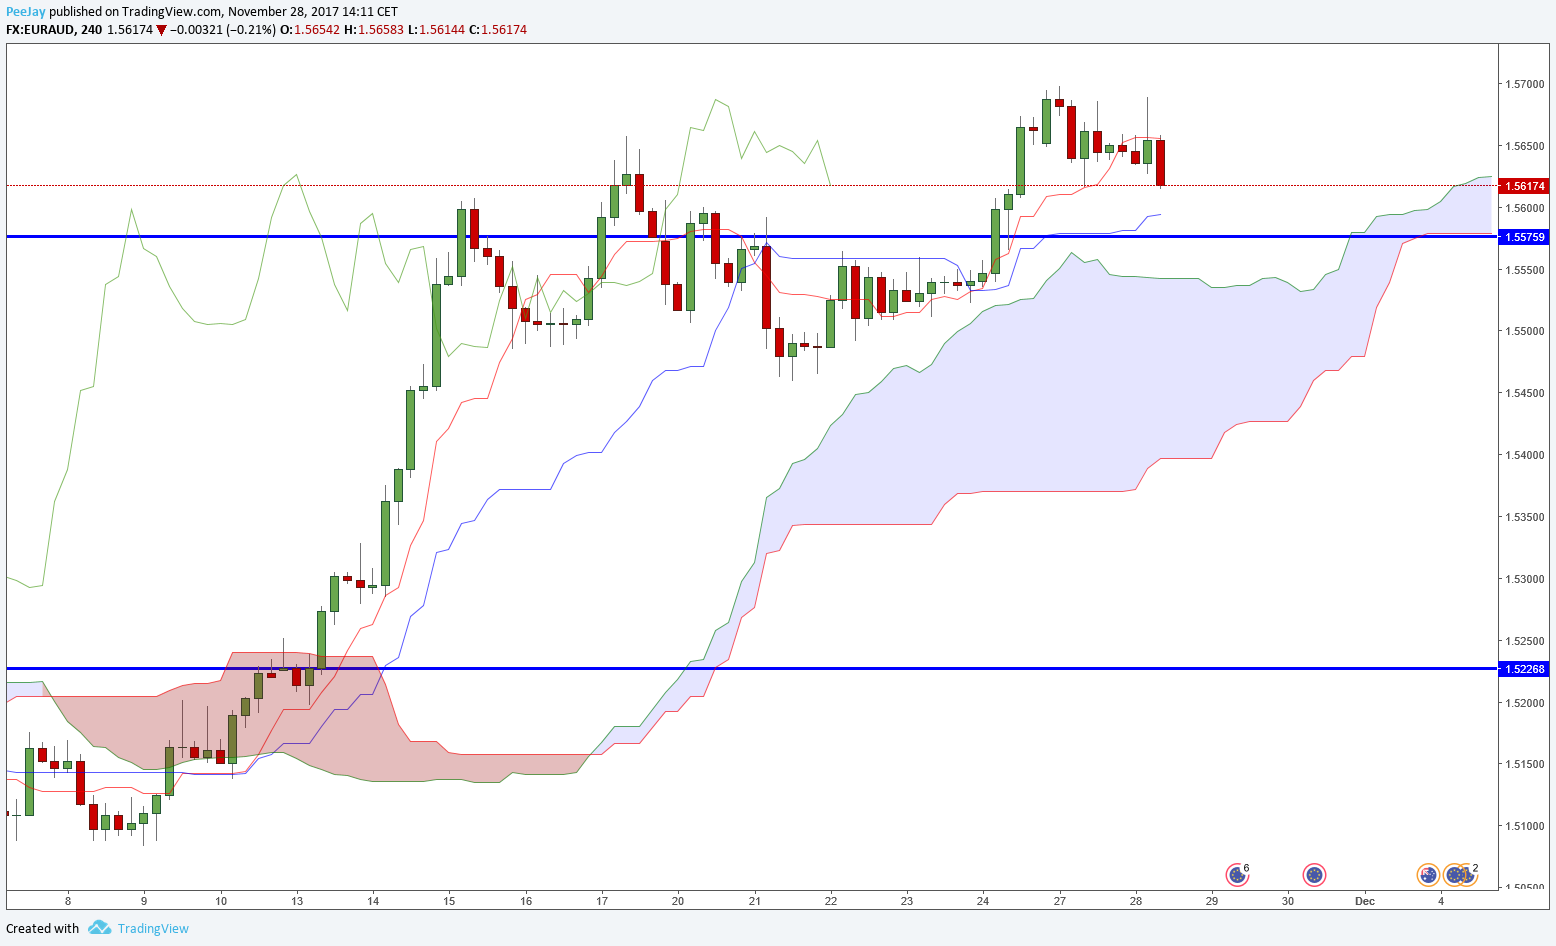
EURAUD
On the H4 chart we can see, that the price broke through important resistance in the 1.5575 area. Currently there is a small bearish correction going on. If in near time there will be buy signal in the area of broken resistance and Kijun line, we can think about opening long position.
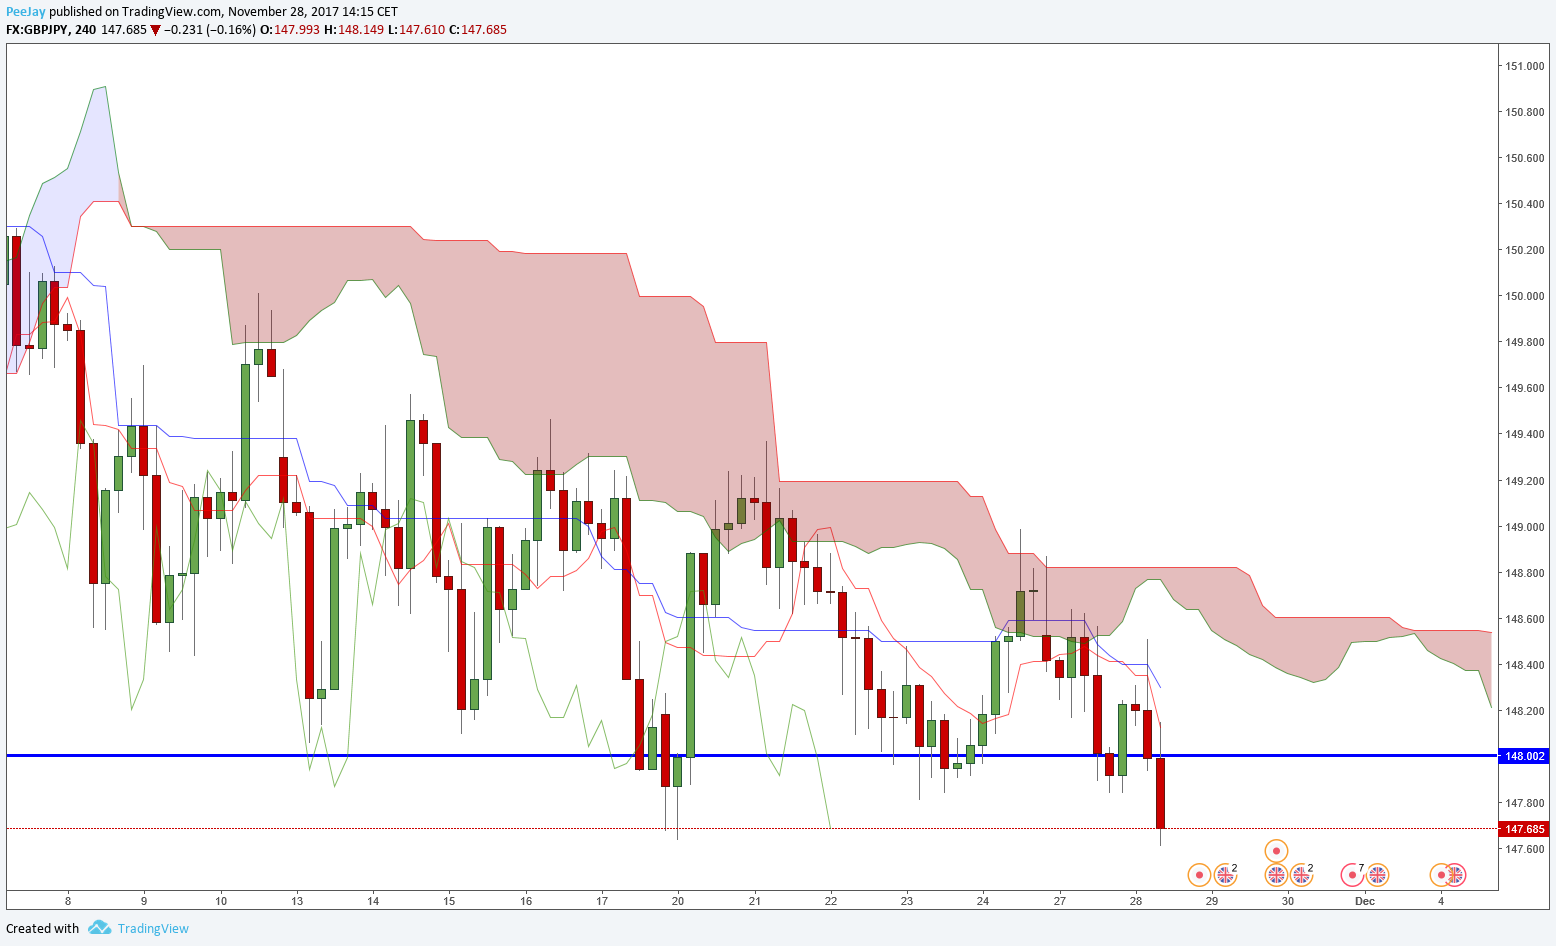
GBPJPY
Current H4 candle broke strongly through the daily support on 148.00. If there will be a retest of this level and some sell signal will show up, it will be an opportunity to open shorts. However, we have to watch out for the Chikou Span position. I recommend to open this position with STO broker, which offers great trading conditions.
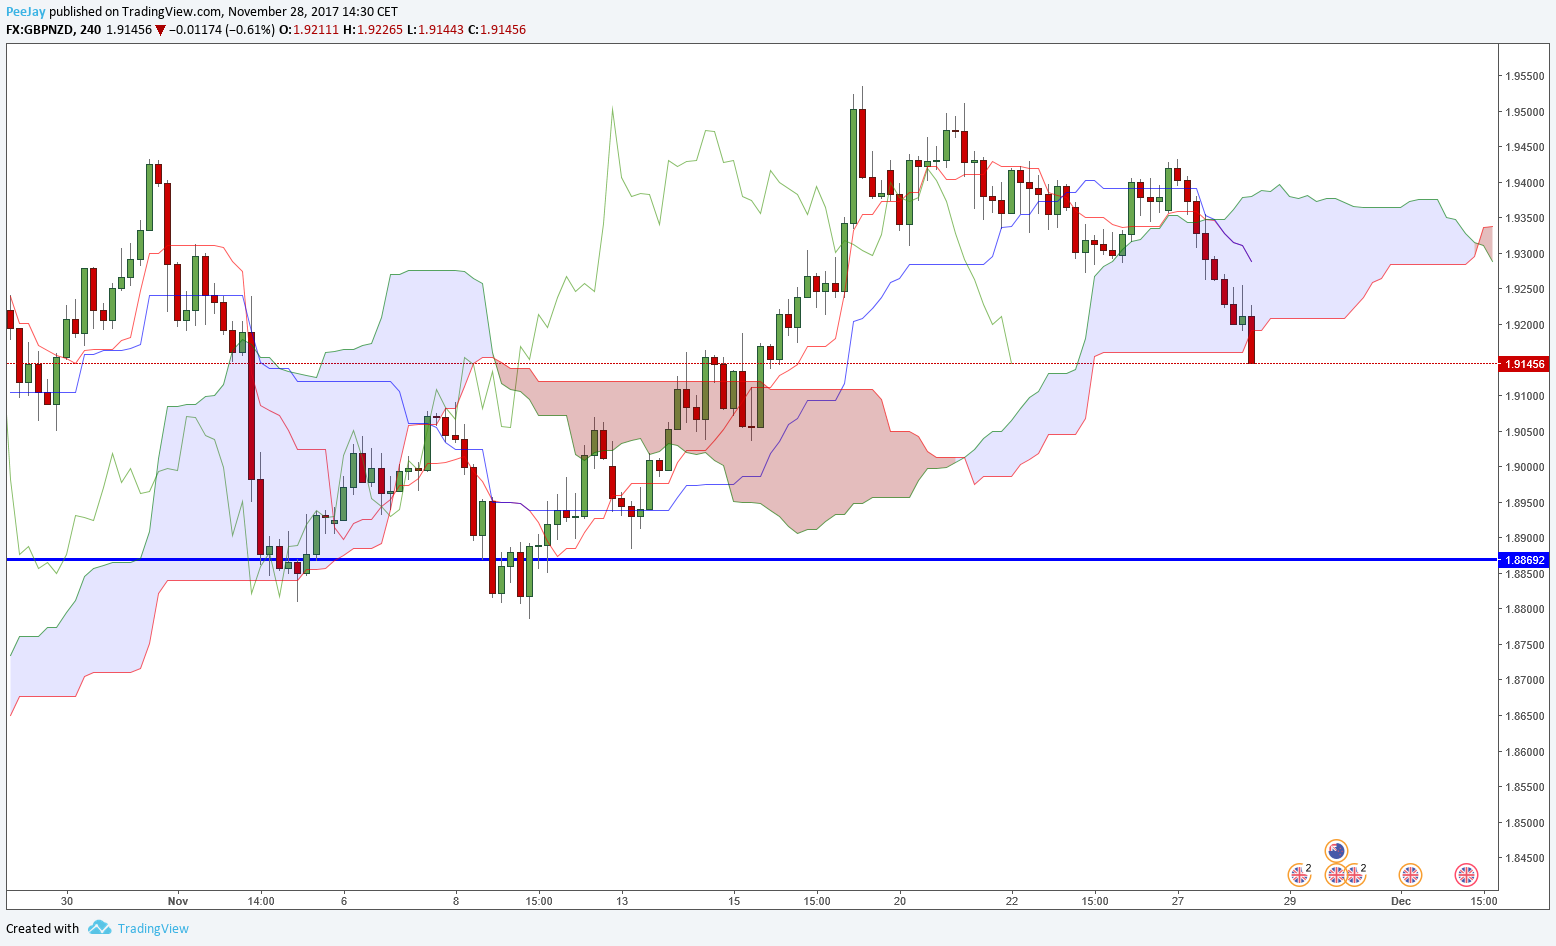
GBPNZD
On the H4 chart we can see, that price without problem broke through bullish Kumo cloud. If current candle will close below it, it will be a weak sell signal. We can open short immediately or wait for Kumo retest and signal candle to show up.


 Review")


