 “Search, Analyse, Trade” is a series of Price Action and Elliott Waves analyses. Its detailed step-by-step description can be found over here. I invite you to today’s review of selected currency pairs and potential trading opportunities. The analyses are based on the Dukascopy sentiment that you can get here.
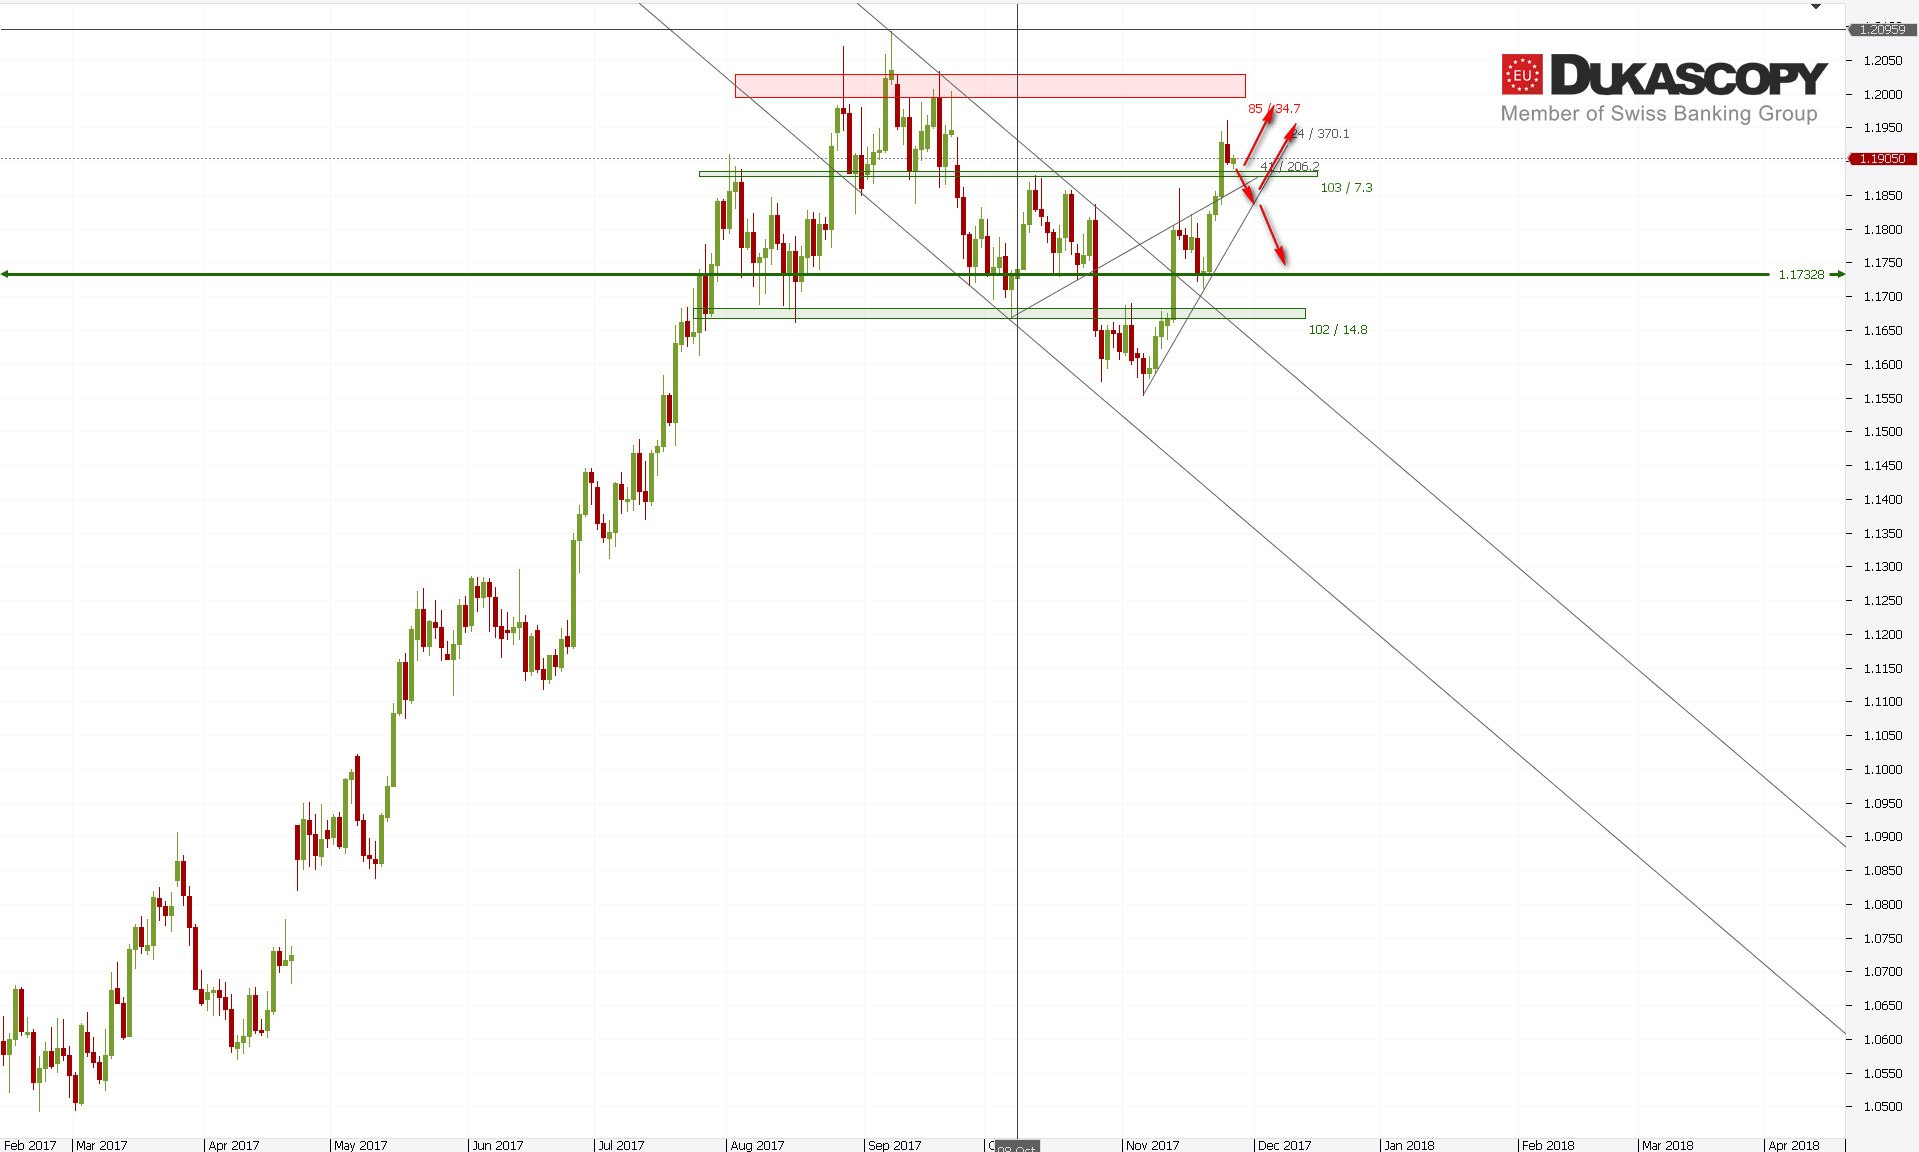 Not much happens on EUR/USD.The pair has rejected local resistance and from this point on we see an attempt to make a correction. The price is slowly approaching key support zone for this moment. Its rejection should lead to attack on the last highs. Its defeat will lead to at least test of her lower limit, and quite likely also to test the neckline of the H&S formation. On chart H4 we can see that the last downward momentum that was formed yesterday may be a c-wave in the irregular correction, so it seems that the first scenario assuming the attempt to attack the last high is more likely.
![]()
![]()
Yesterday’s sentiment almost did not change. We have a slight increase in short positions. This layout does not allow us to search for long trade. However, if the pair turns back and breaks through the tested resistance zone, a short can be considered.
The partner of “Search, Analyse, Trade” series is a Dukascopy Europe broker who gives its customers access to ECN accounts in different currencies.
Trade on Forex, indices and commodities thanks to Swiss FX & CFD Marketplace. Open free trading account right now.
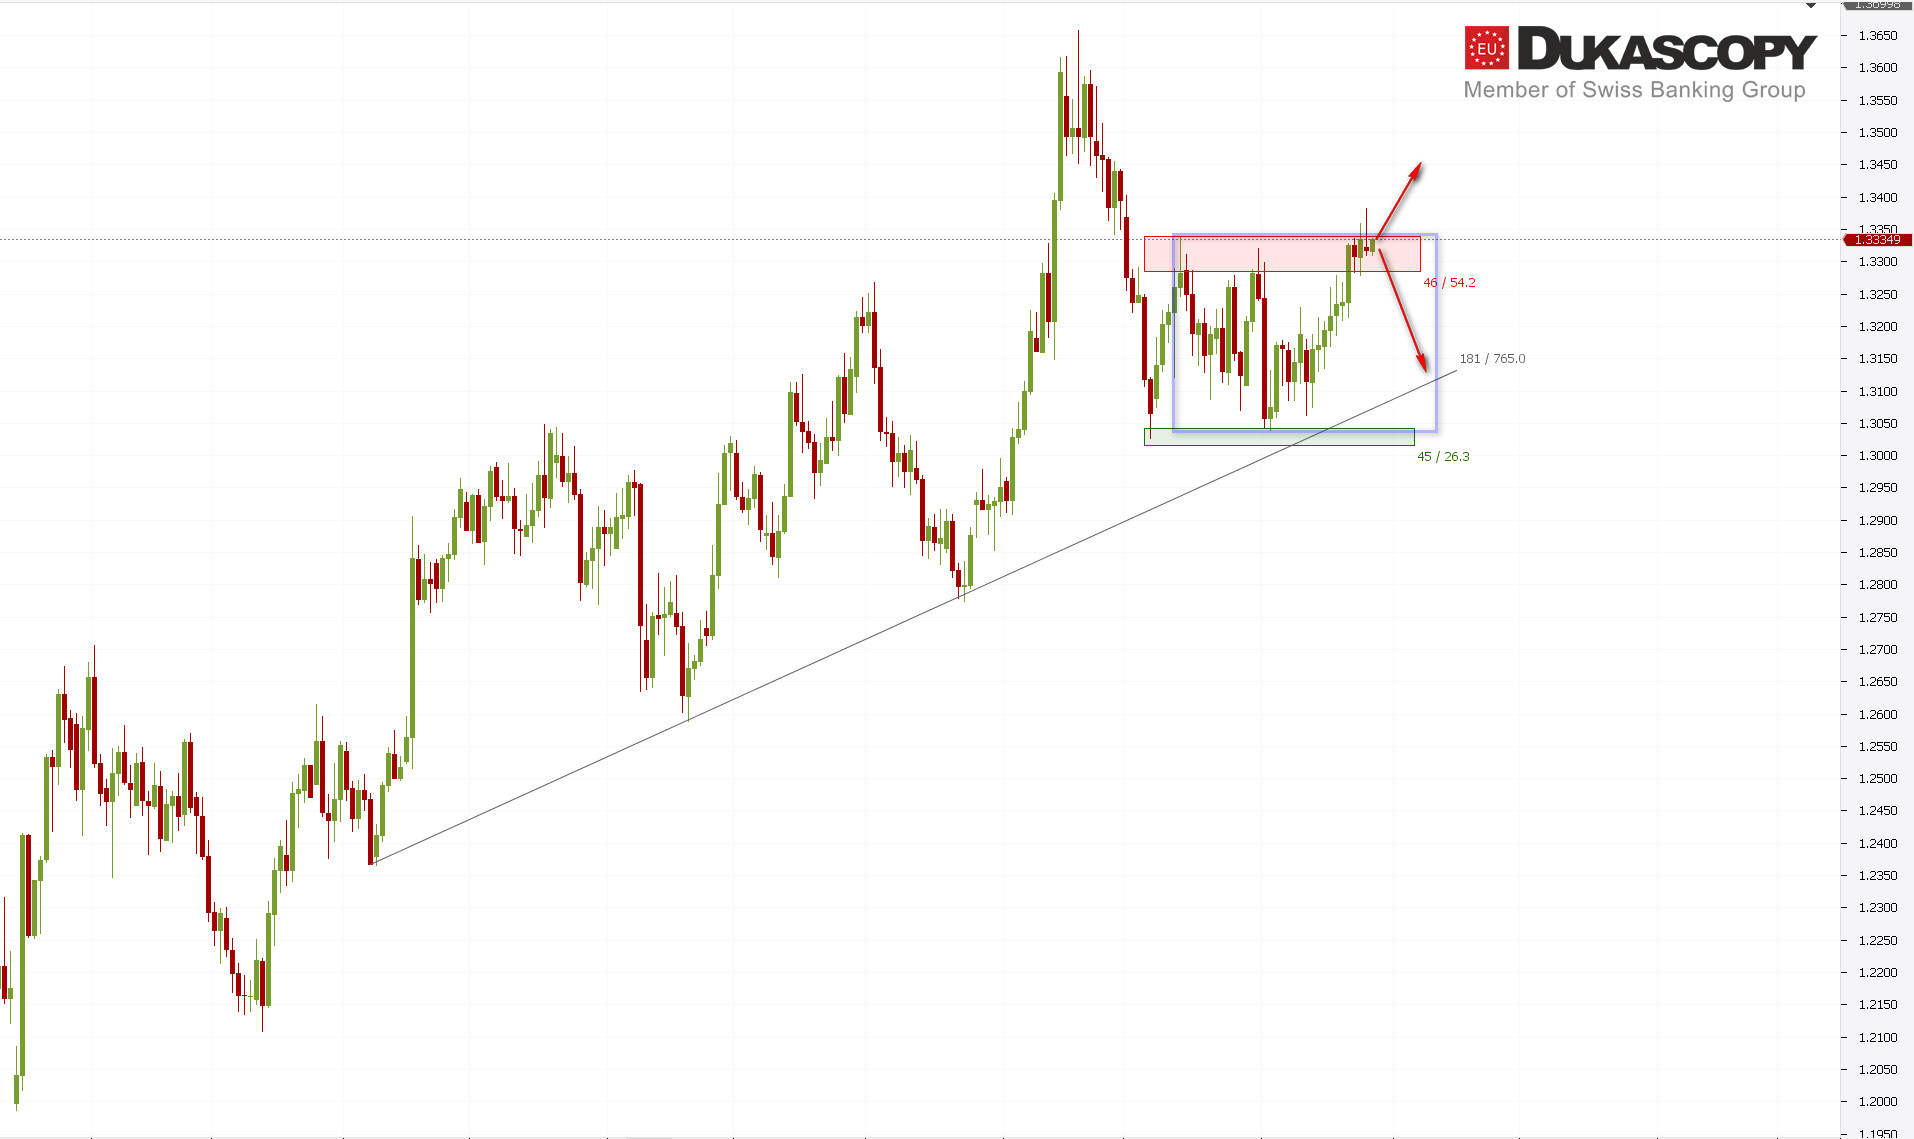 GBP/USD has initially rejected the upper consolidation limit and Inside Bar from the weekly chart. A Pin Bar was created but still the move seems not completed. There is missing one more attempt to attack this zone. The entire upward movement from the bottom, as we can see on the H4 chart, is typical for correction rather than impulse, so the scenario with the end of the ABC correction started in September and the continuation of the declines in the 3C wave is the main scenario. Only defeating the tested zone negates this variant.
![]()
![]()
Also, in this case the sentiment is not changing. It stays neutral, allowing us to look for short positions and play under the 3C wave.
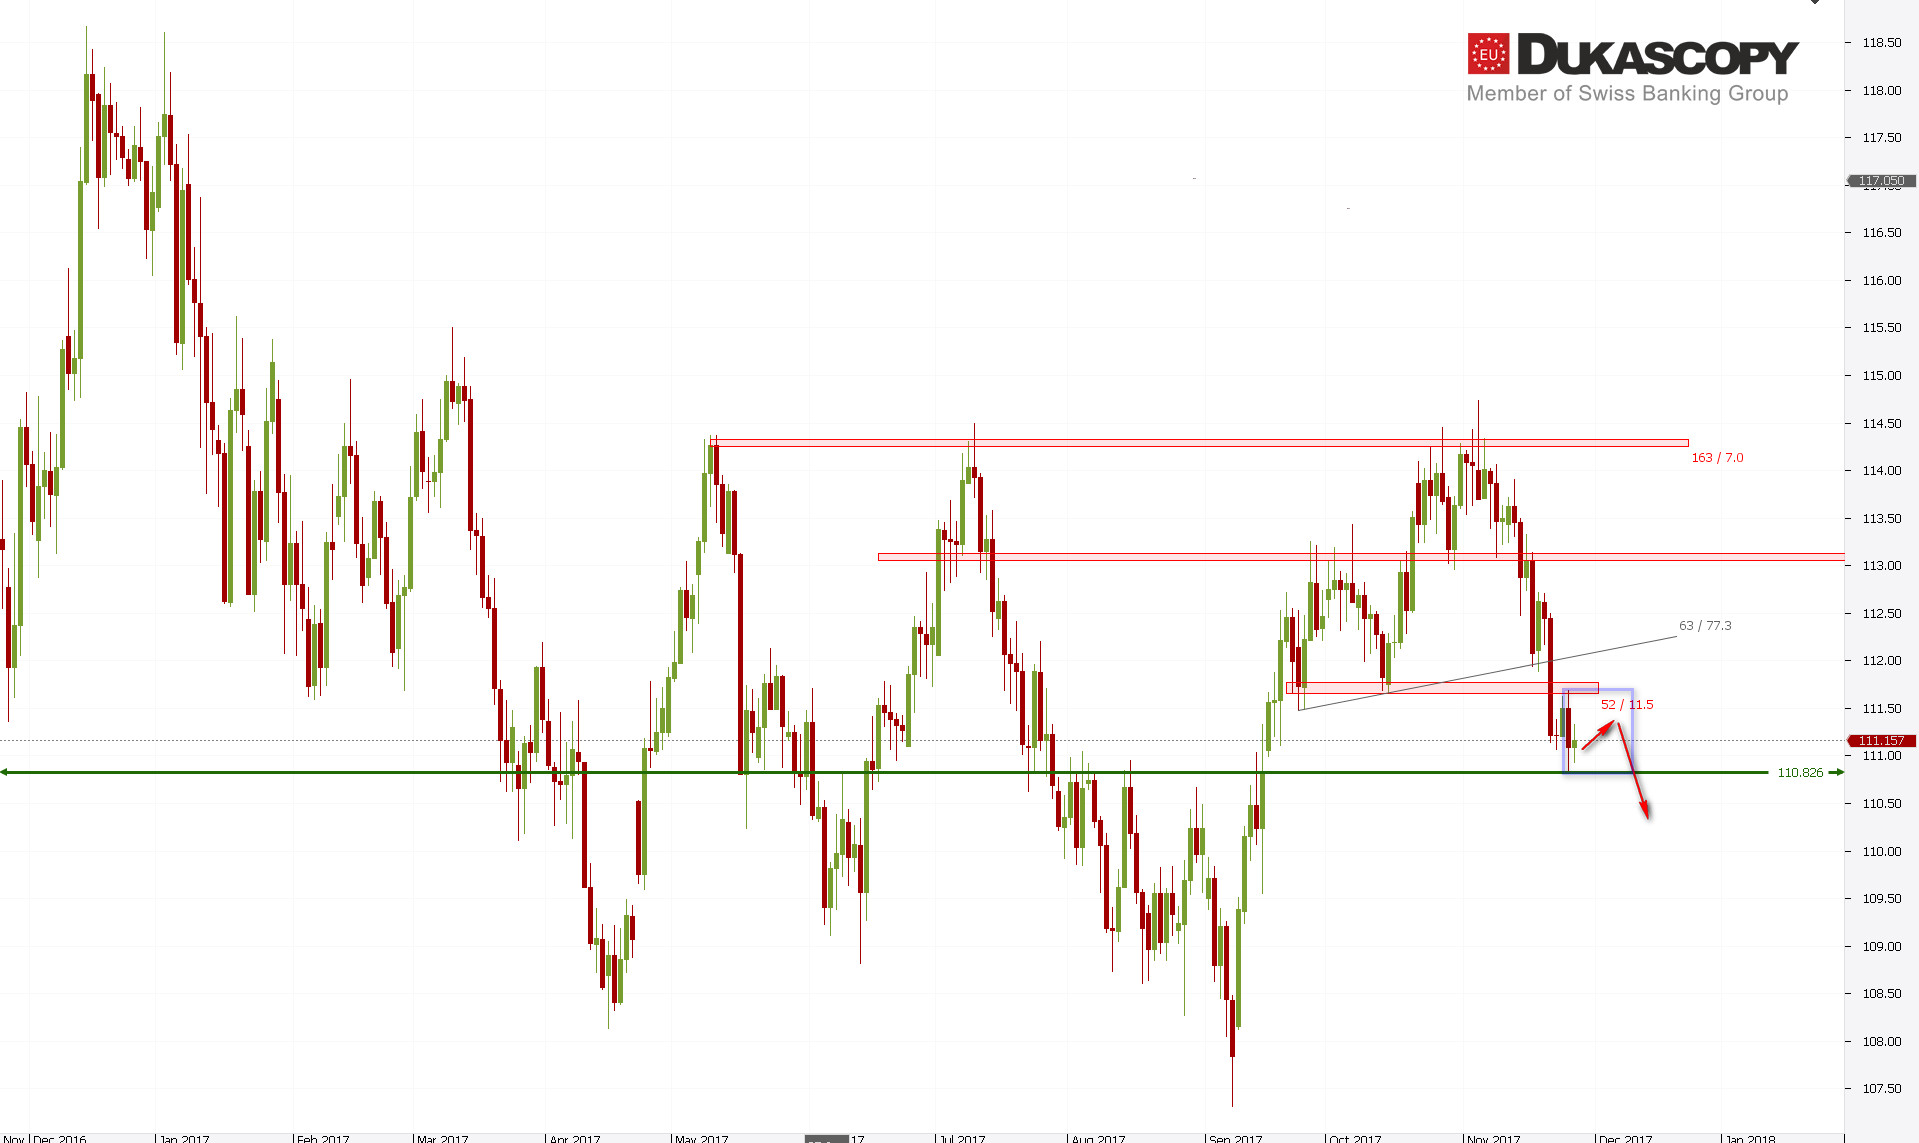 USD/JPY has rejected yesterday’s resistance zone and has reached support. The IB is created, and breaking out of it will signal continuation of the decline. The wave pattern that has been developing since setting the high has not yet been completed. Now we are still in wave 3. The current correction can be wave 4 and after that we should see the next wave of declines.
![]()
![]()
Short positions are falling a bit but the sentiment pattern remains on the short side. Breaking out from IB will be an opportunity to join the bears.


 Review")


