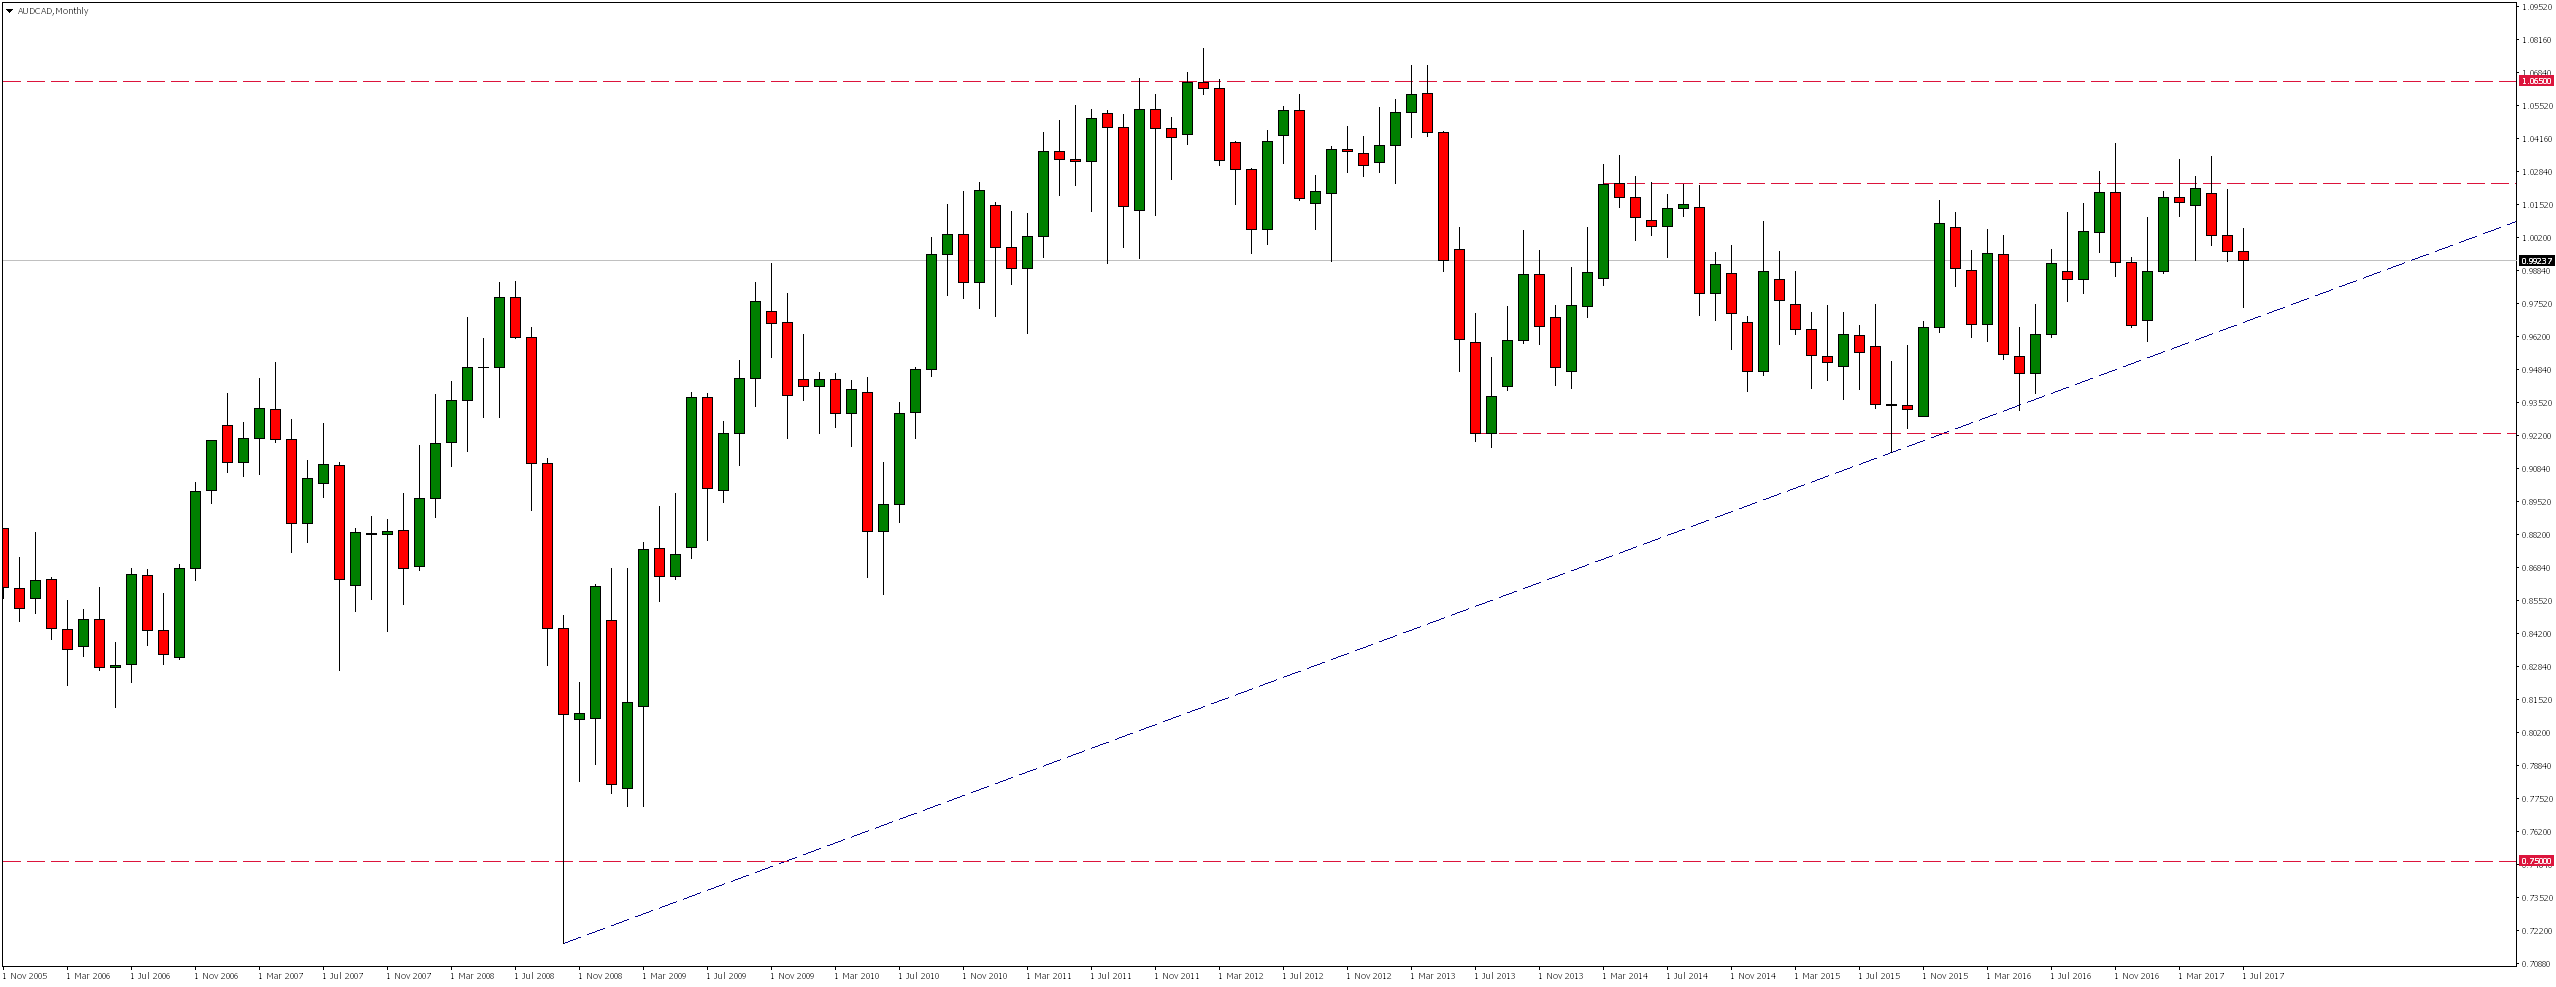
AUDCAD since August 2013 is moving in consolidation. It is worth noting that since September 2015 when market rejected its lower limit, the line of bullish trend has already stopped supply several times before further decline.
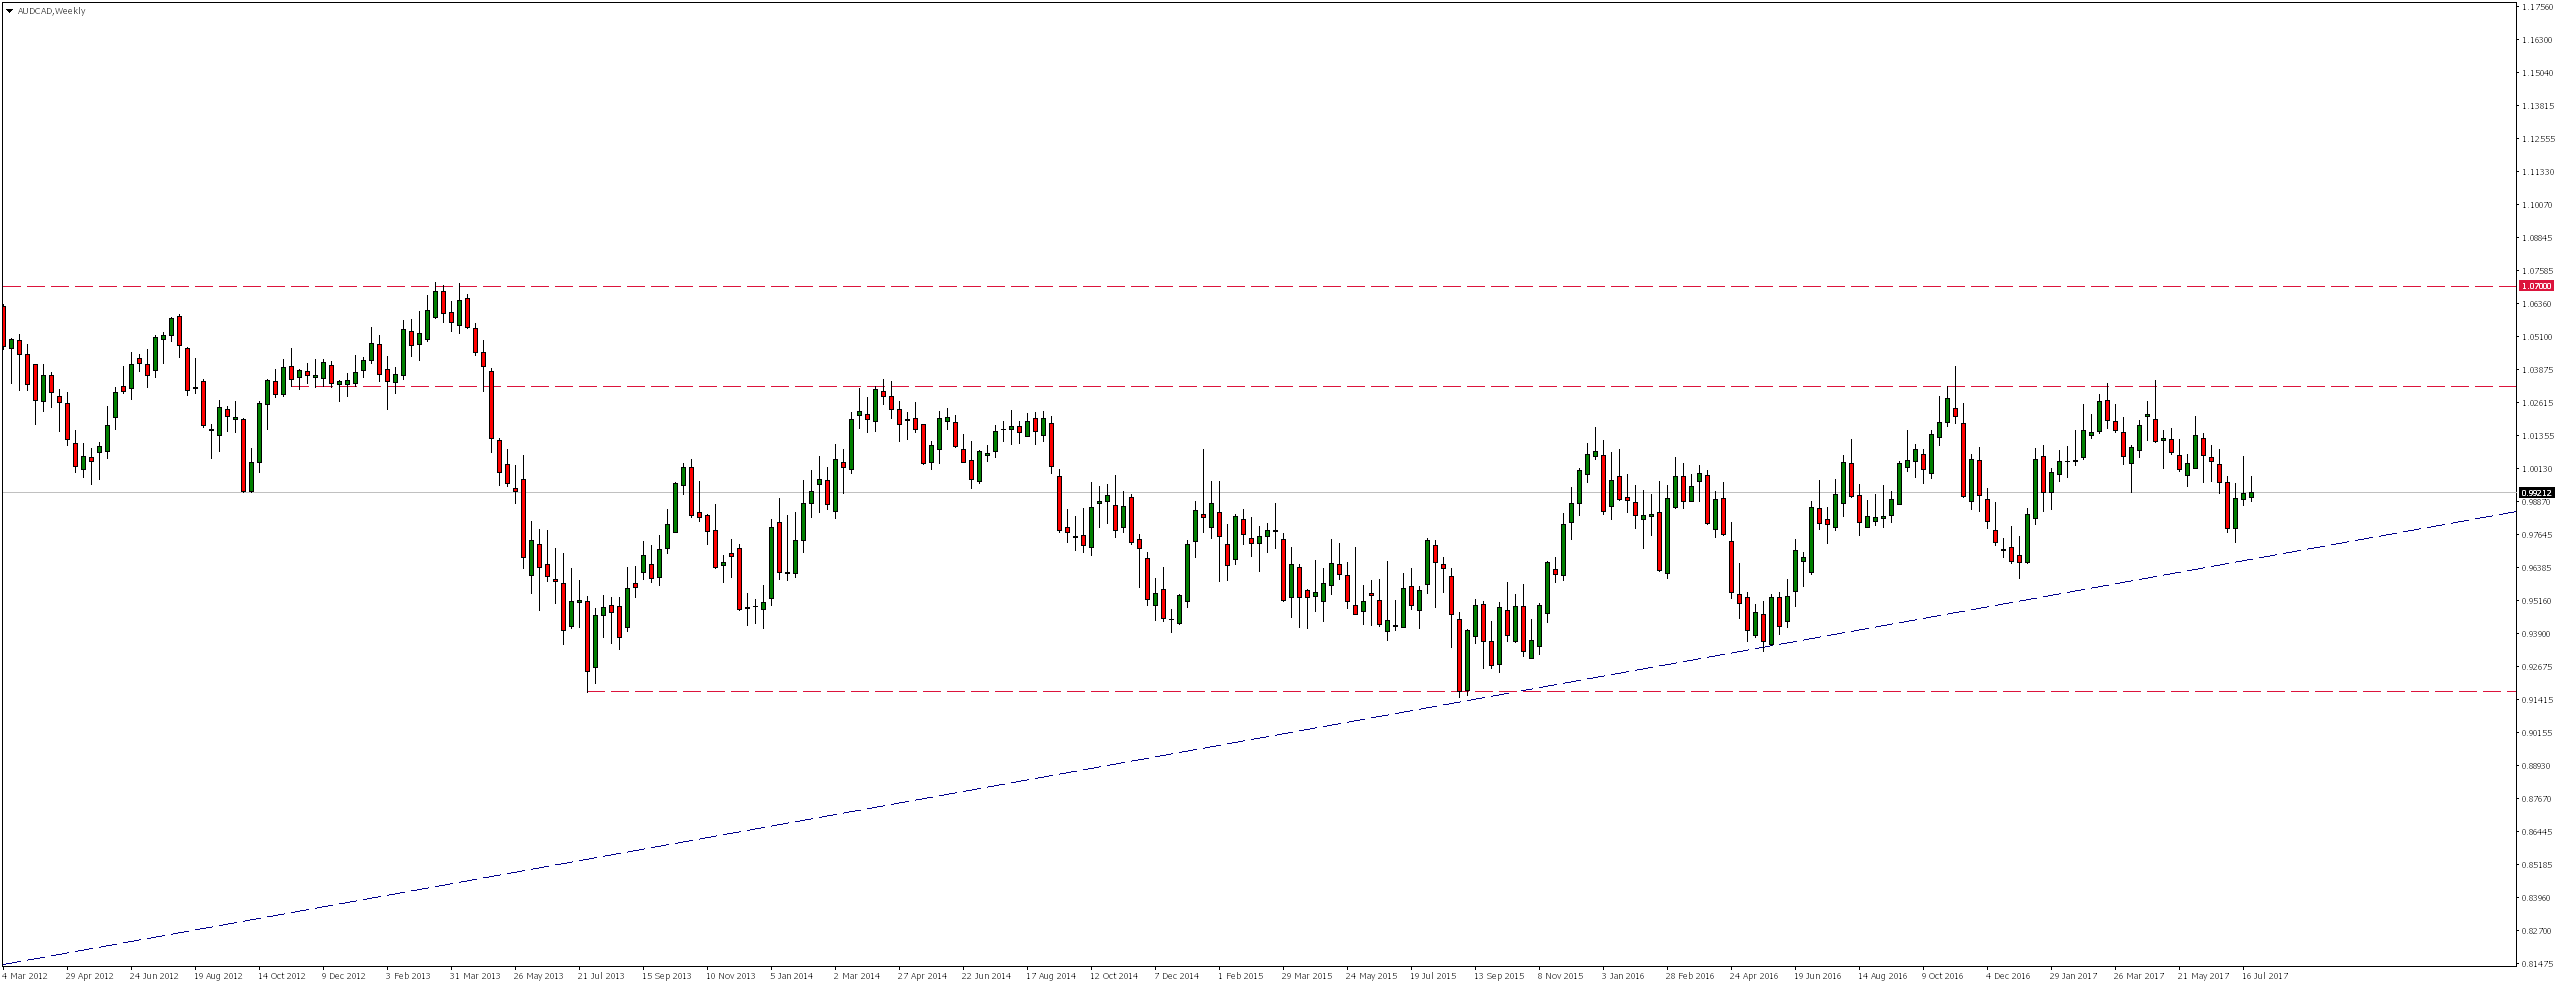
Consolidation is much better seen on weekly chart. It is worth noting that after each test of the upper limit of this box, subsequent declines were getting smaller.
Looking at daily chart, we notice that due to recent upswing market has overcome local resistance, pair reached only level of bearish trend line, where Last Thursday there was a supply reaction.
Error, group does not exist! Check your syntax! (ID: 4)
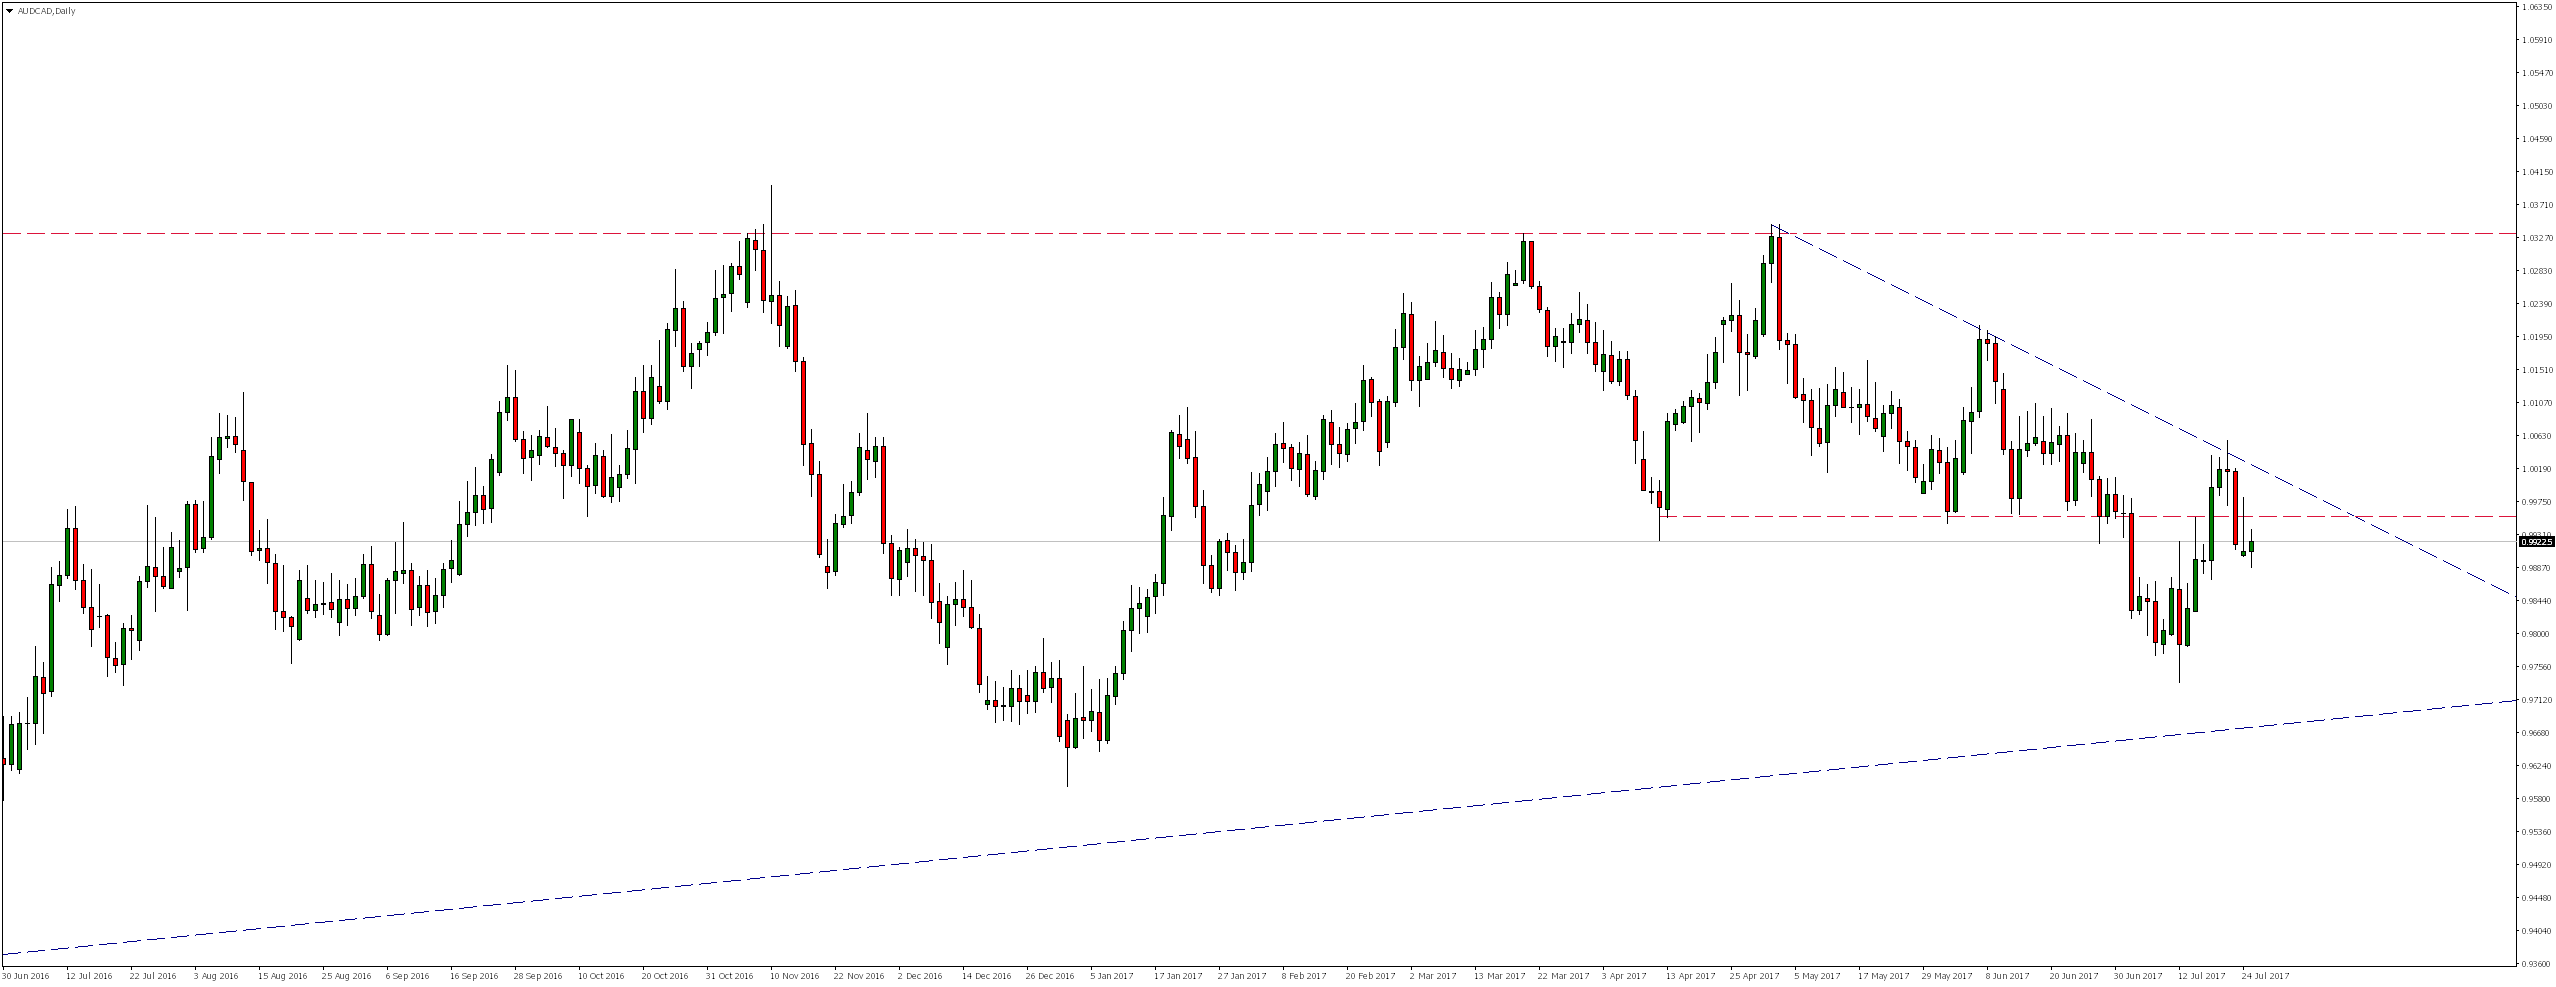
As a result of Friday’s declines market was below this level again end it was re-tested twice on Friday and yesterday.
If this bearish trend continues, we might be able to test level around 0.9755.


 Review")


