From Investor to Scalper is a cycle of analysis in which we take one financial instrument and the analysis includes a detailed look at the value from the monthly/weekly chart to the H1/M30.
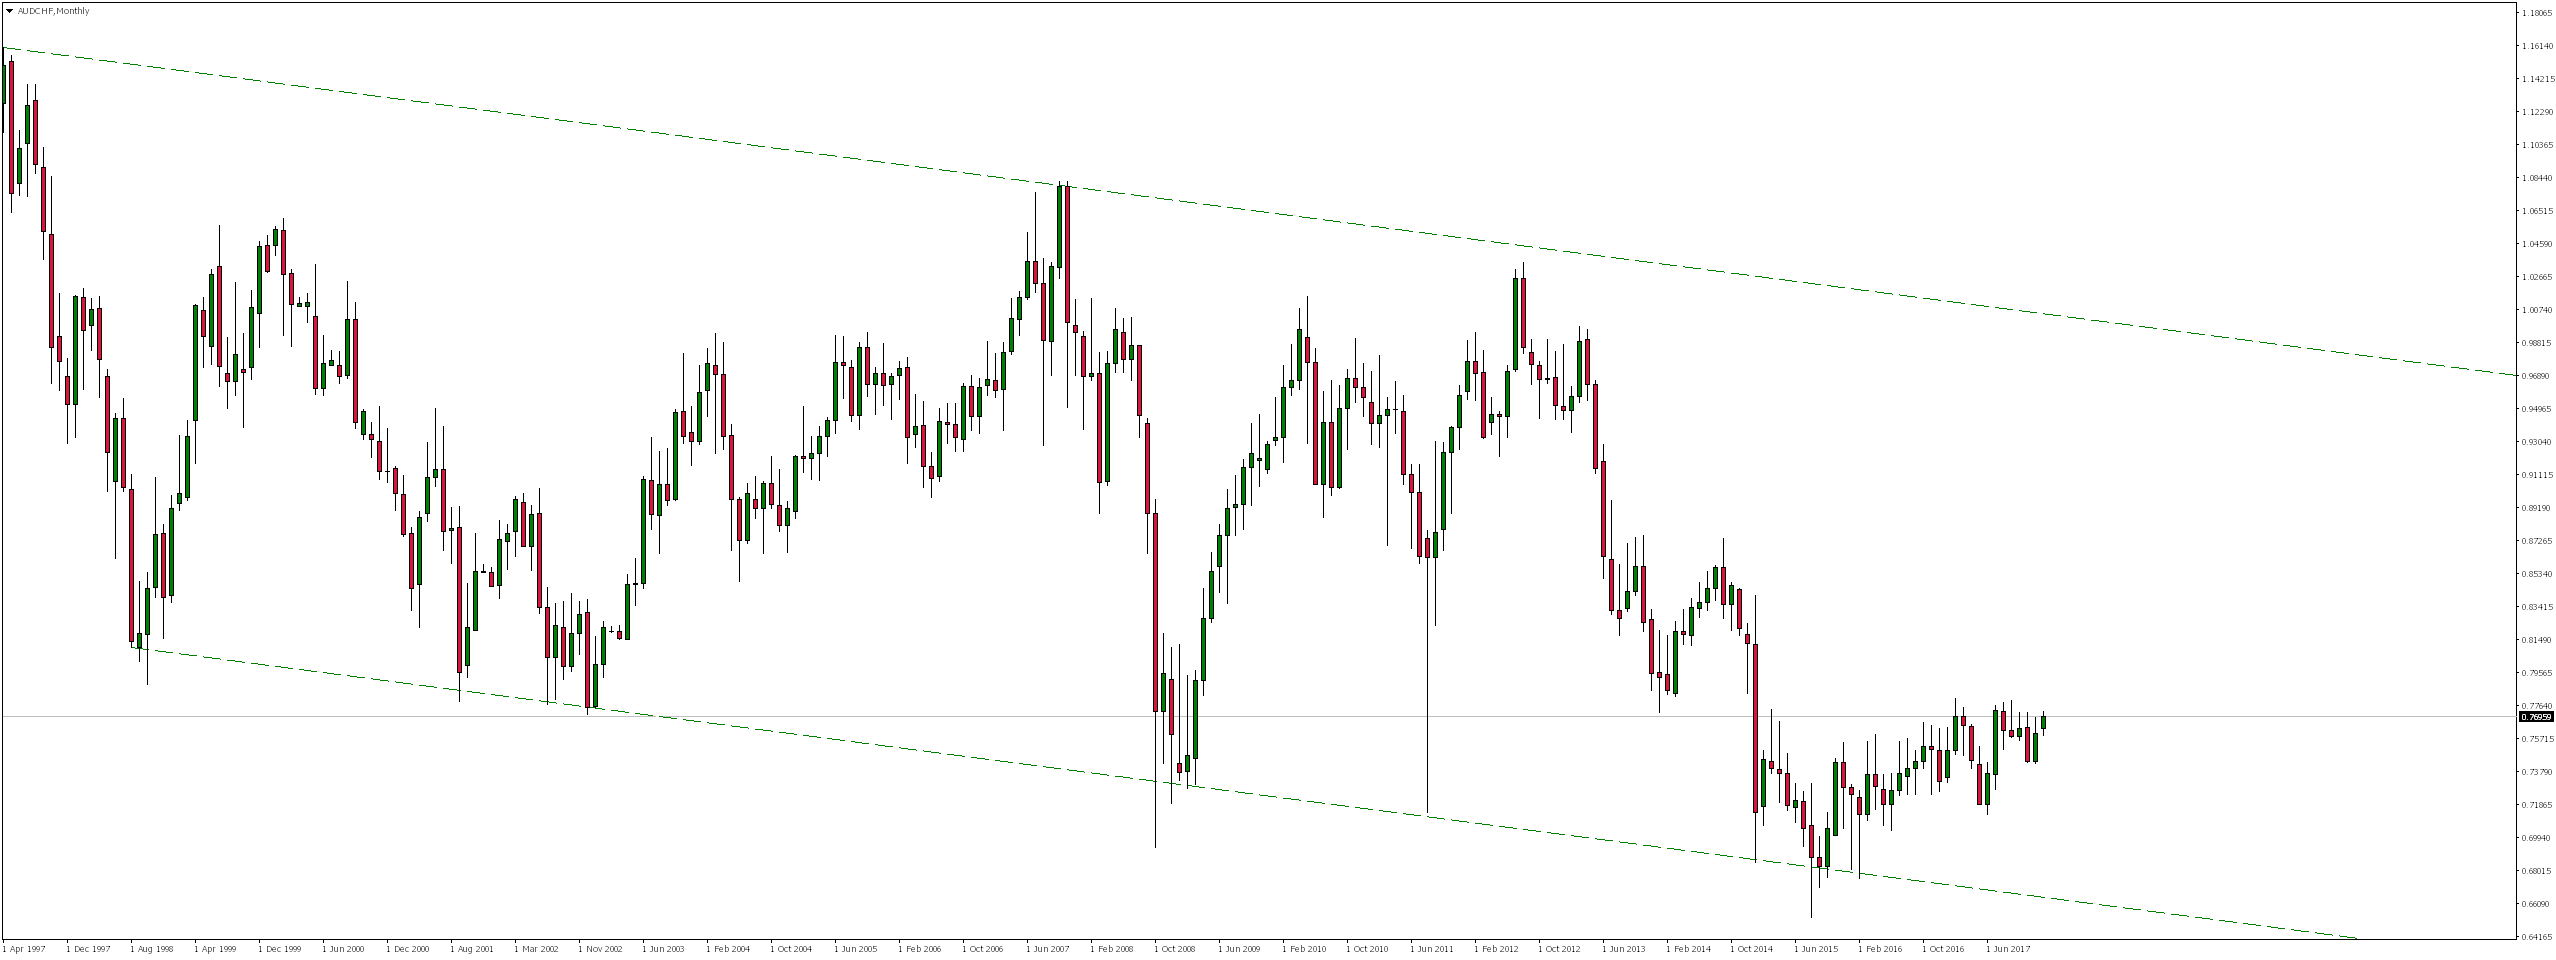
The AUDCHF has been moving in a bearish channel for a long time. As a result of the rejection of the lower limitations of the formation, from October 2015, however, we can observe increases which, if we compare with the current history on this instrument, seem less dynamic.
Looking at the weekly chart, we can see that the exchange rate for 3 years and more precisely from the memorable “Black Thursday”, when the drastic and unexpected market collapse was caused by the decision of the Swiss National Bank (SNB) to cut interest rates and abandon the fixed EUR / CHF exchange rate to Height 1.20, moves in a horizontal trend.
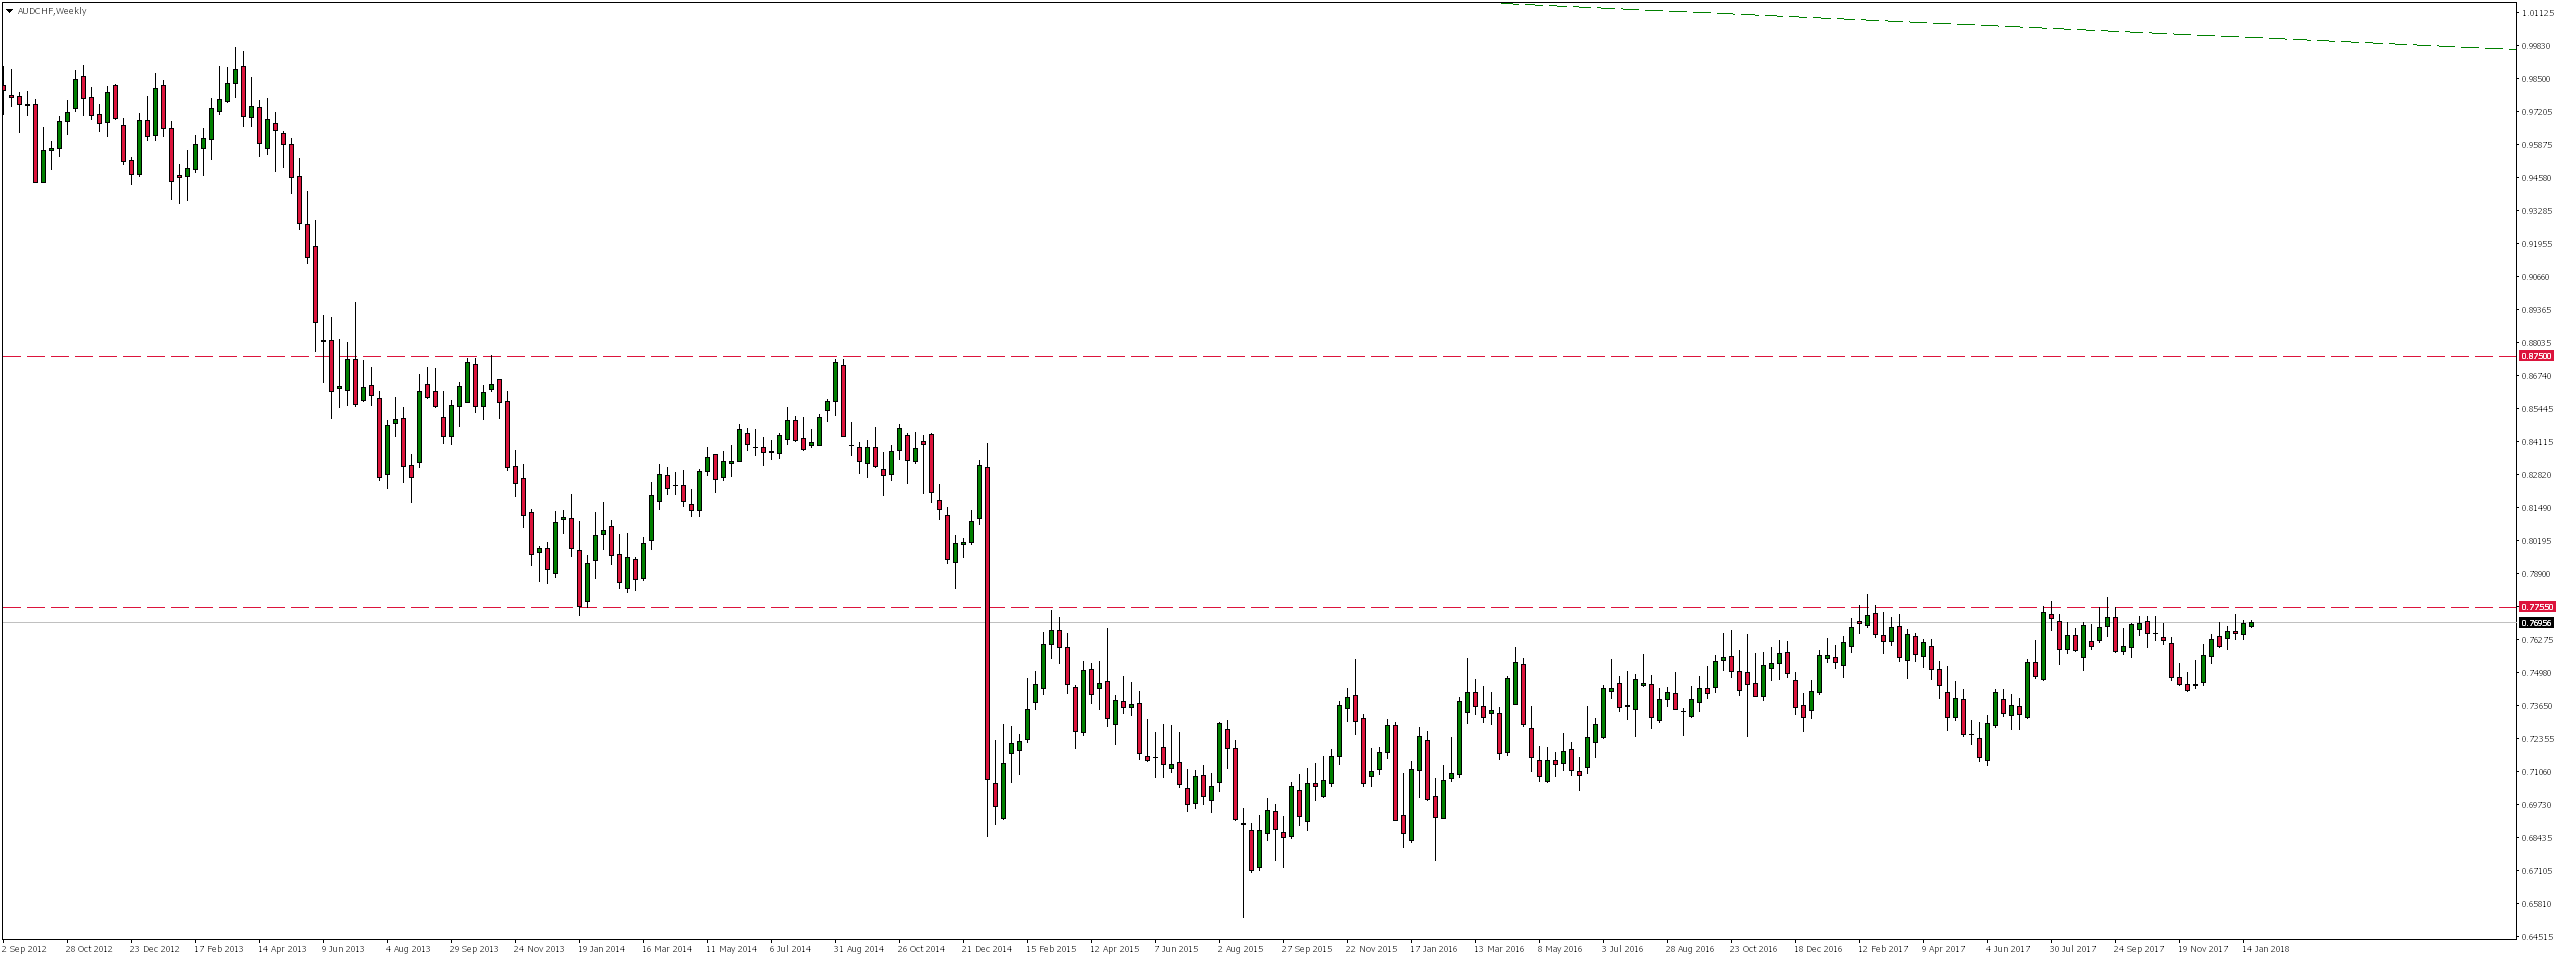
It is worth noting that the pair very accurately tested the level of 0.7750 defeated as a result of the SNB decision. In January 2014, this level was a significant support and after defeating it turned into resistance and despite numerous re-tests, it still remains unbeaten.
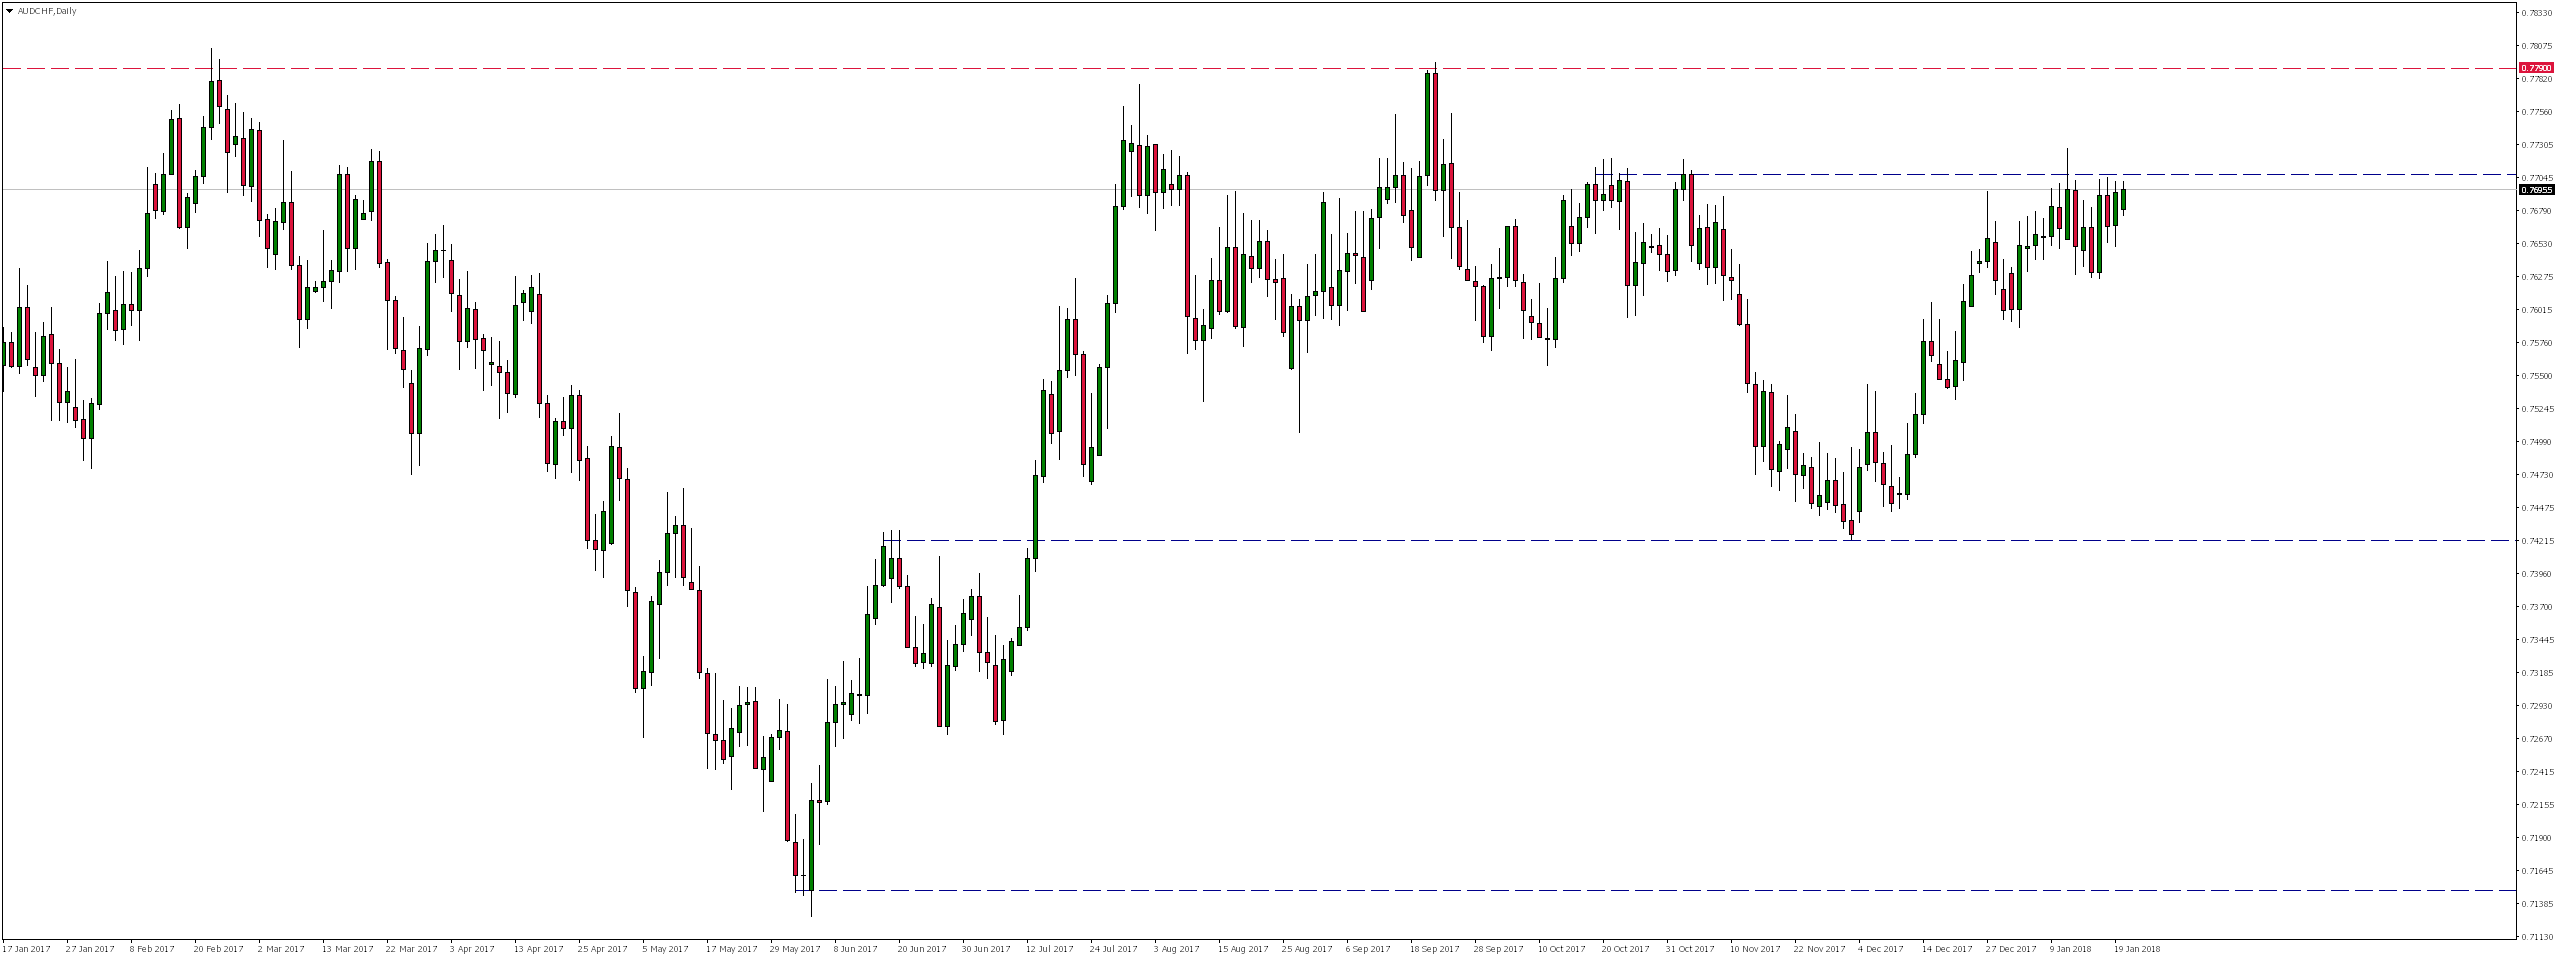
Error, group does not exist! Check your syntax! (ID: 4)On the daily chart, we notice that the exchange rate is currently fluctuating near the local resistance, where a supply reaction appeared few days ago. Nevertheless, the zone has not been permanently rejected. If that happened, we could expect declines even in the vicinity of December lows, which gives over 280 pips. Overcoming this resistance could open the way for further increases by another 100 pips.


 Review")


