From Investor to Scalper is a cycle of analysis in which we take one financial instrument and the analysis includes a detailed look at the value from the monthly/weekly chart to the H1/M15.
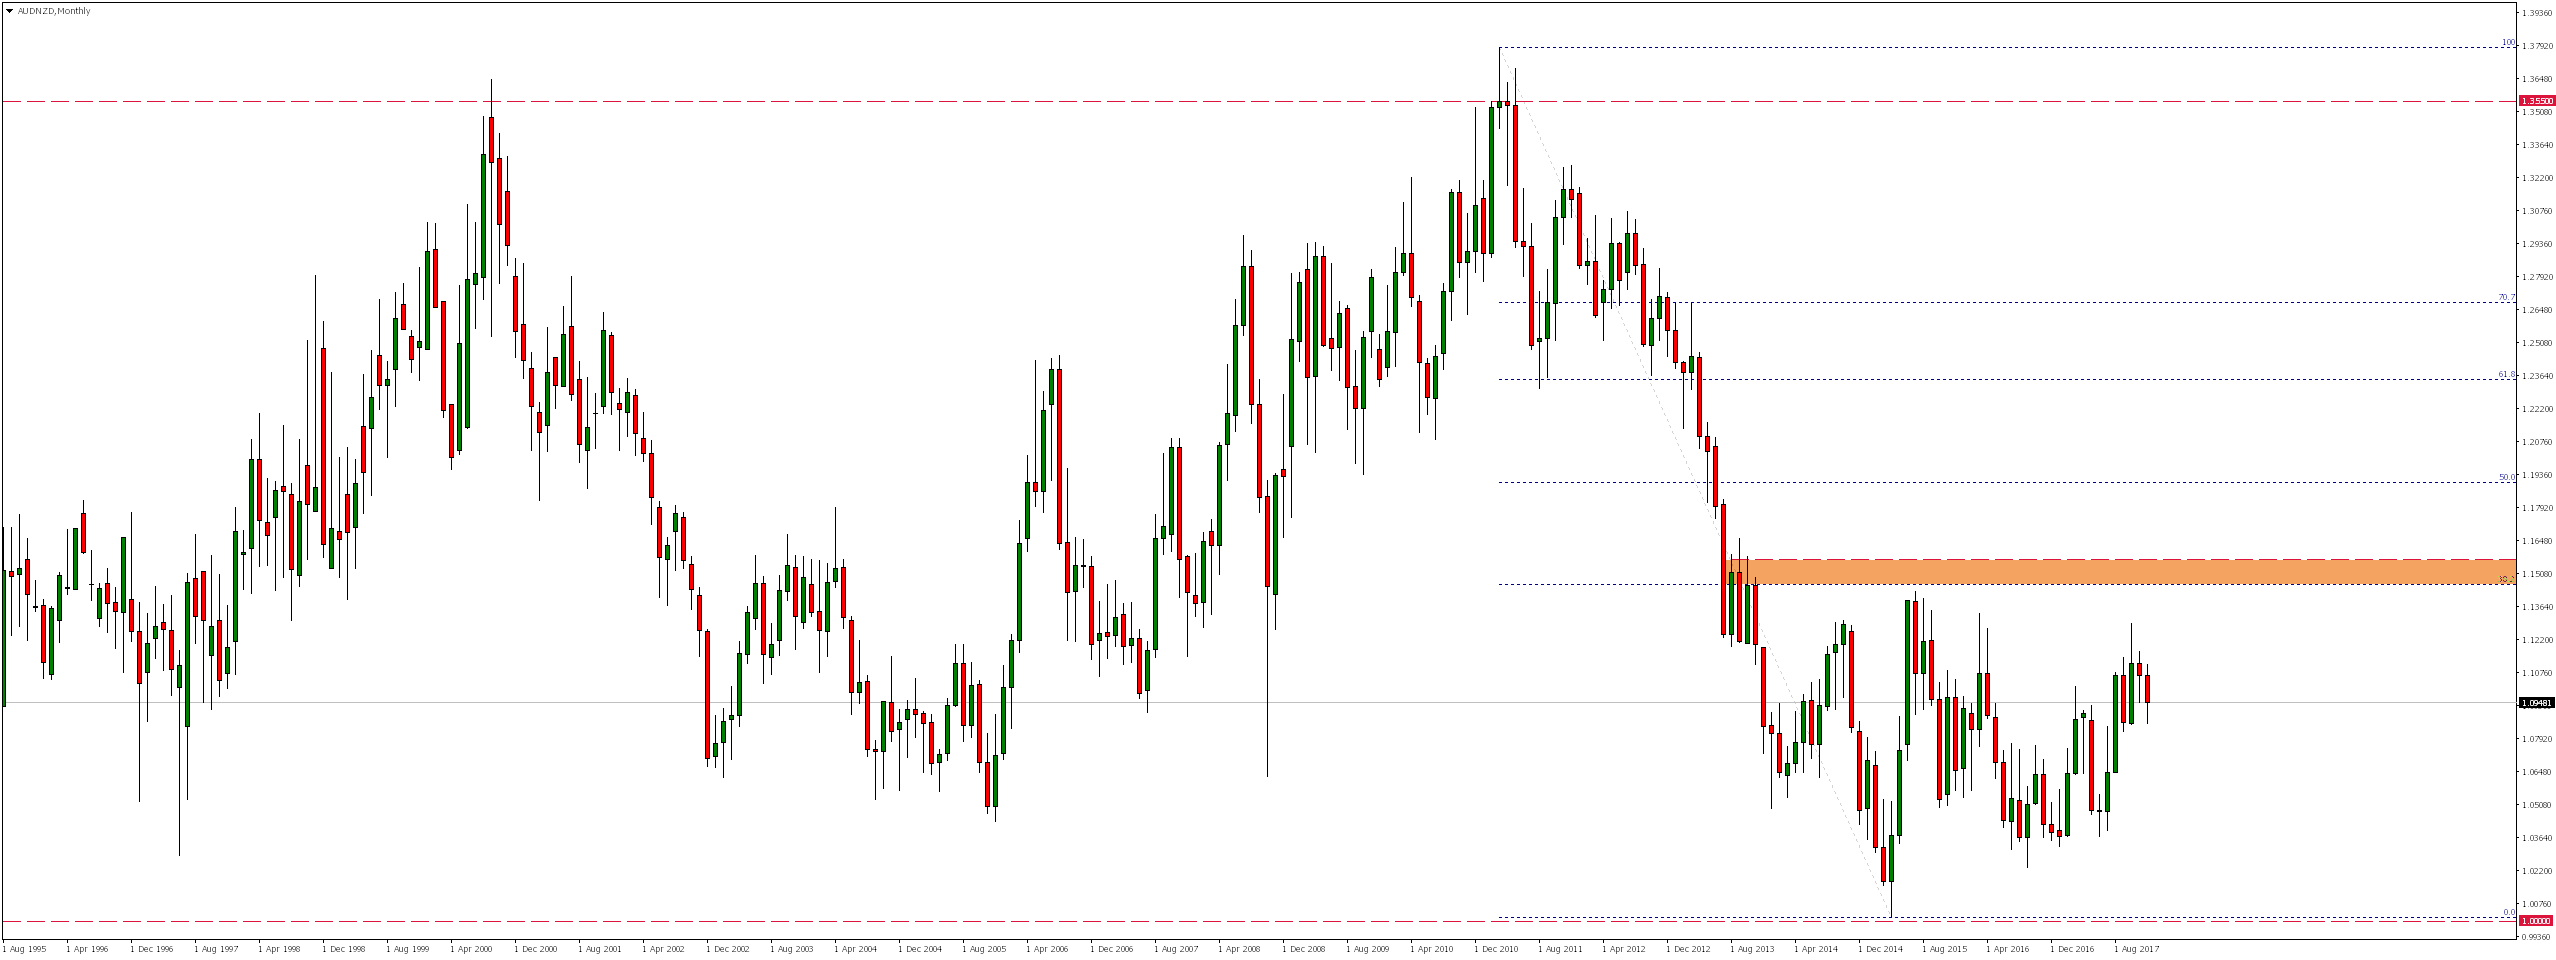
As a result of declines lasting from April 2011 AUDNZD reached the level of 1.0000, where in April 2015 a demand reaction has appeared. Since then, we have been observing pair move in consolidation, whose upper limit coincides with the measurement of 38.2% Fibonacci adjustment.
This consolidation, which has been lasting for over 4 years, is clearly visible on the weekly chart. Considering that in October we tested the vicinity of local resistance 1.1300, where supply reaction appeared, in the near future we could expect continuation of declines going on from that time.
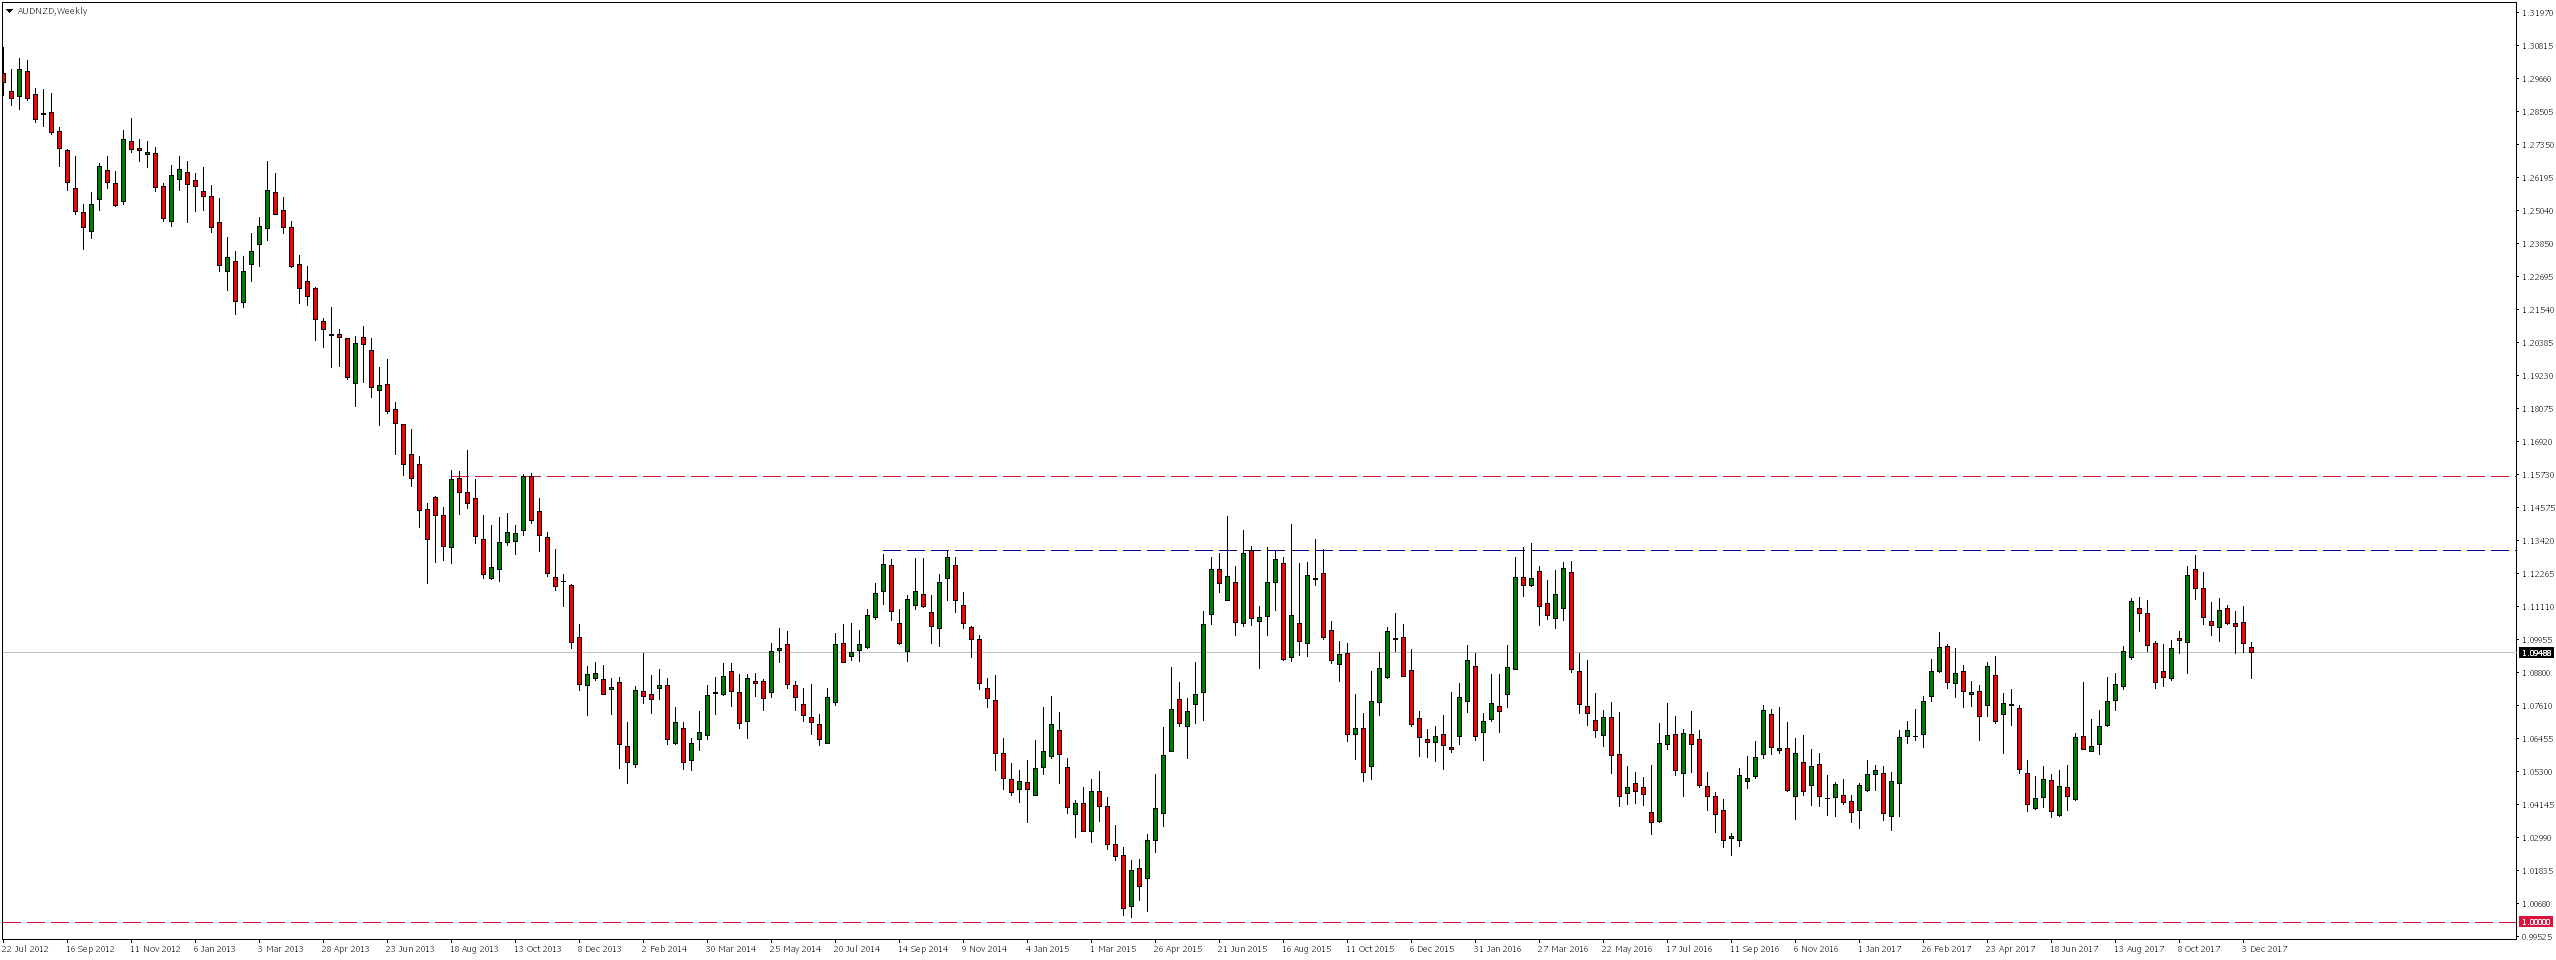
But for this could happen, the course would have to first overcome local support coinciding with measuring 38.2 % Fibonacci correction. Although this zone has not been precisely tested, today a strong demand reaction has emerged.
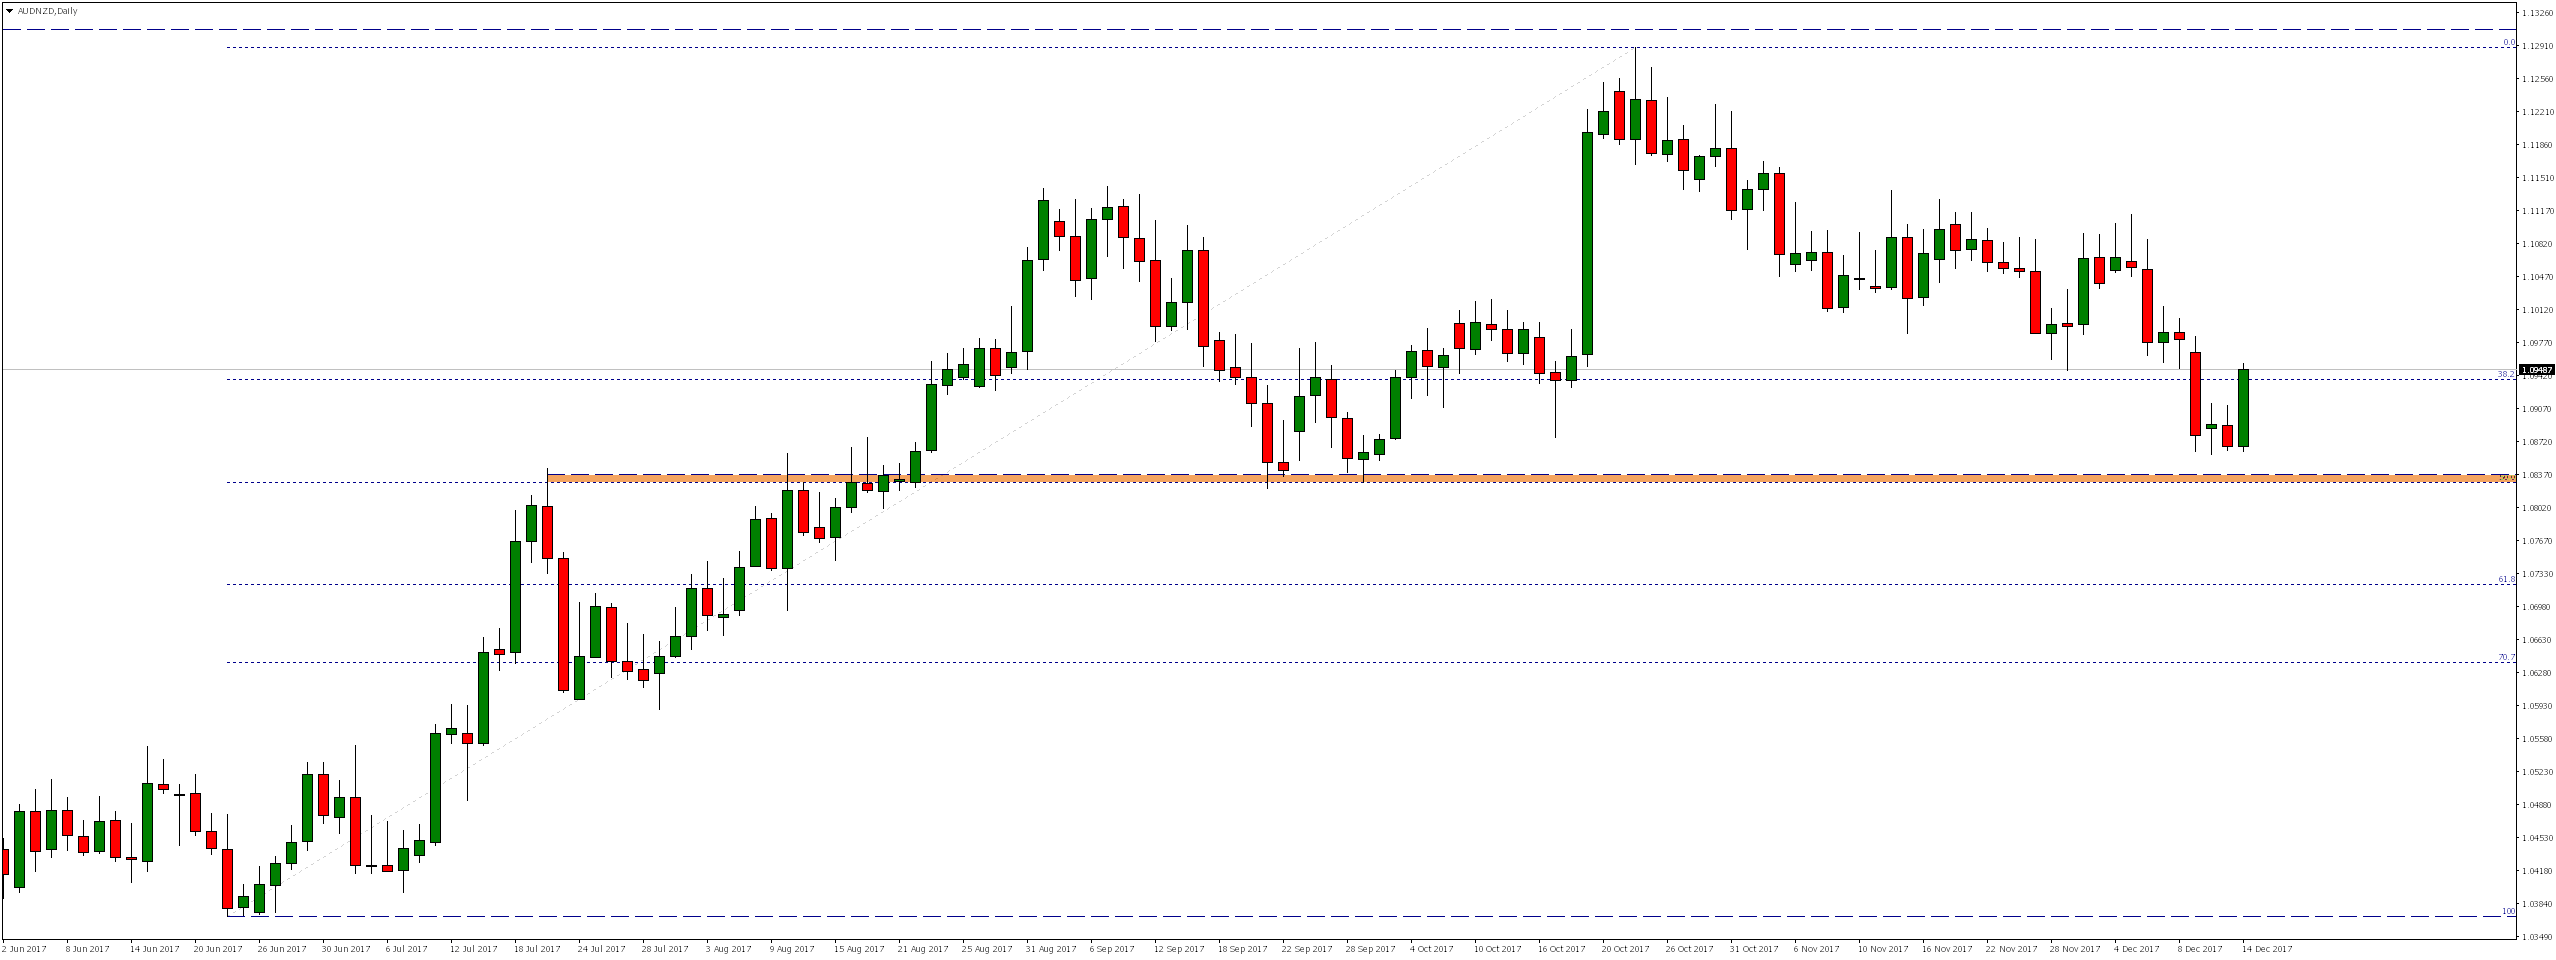
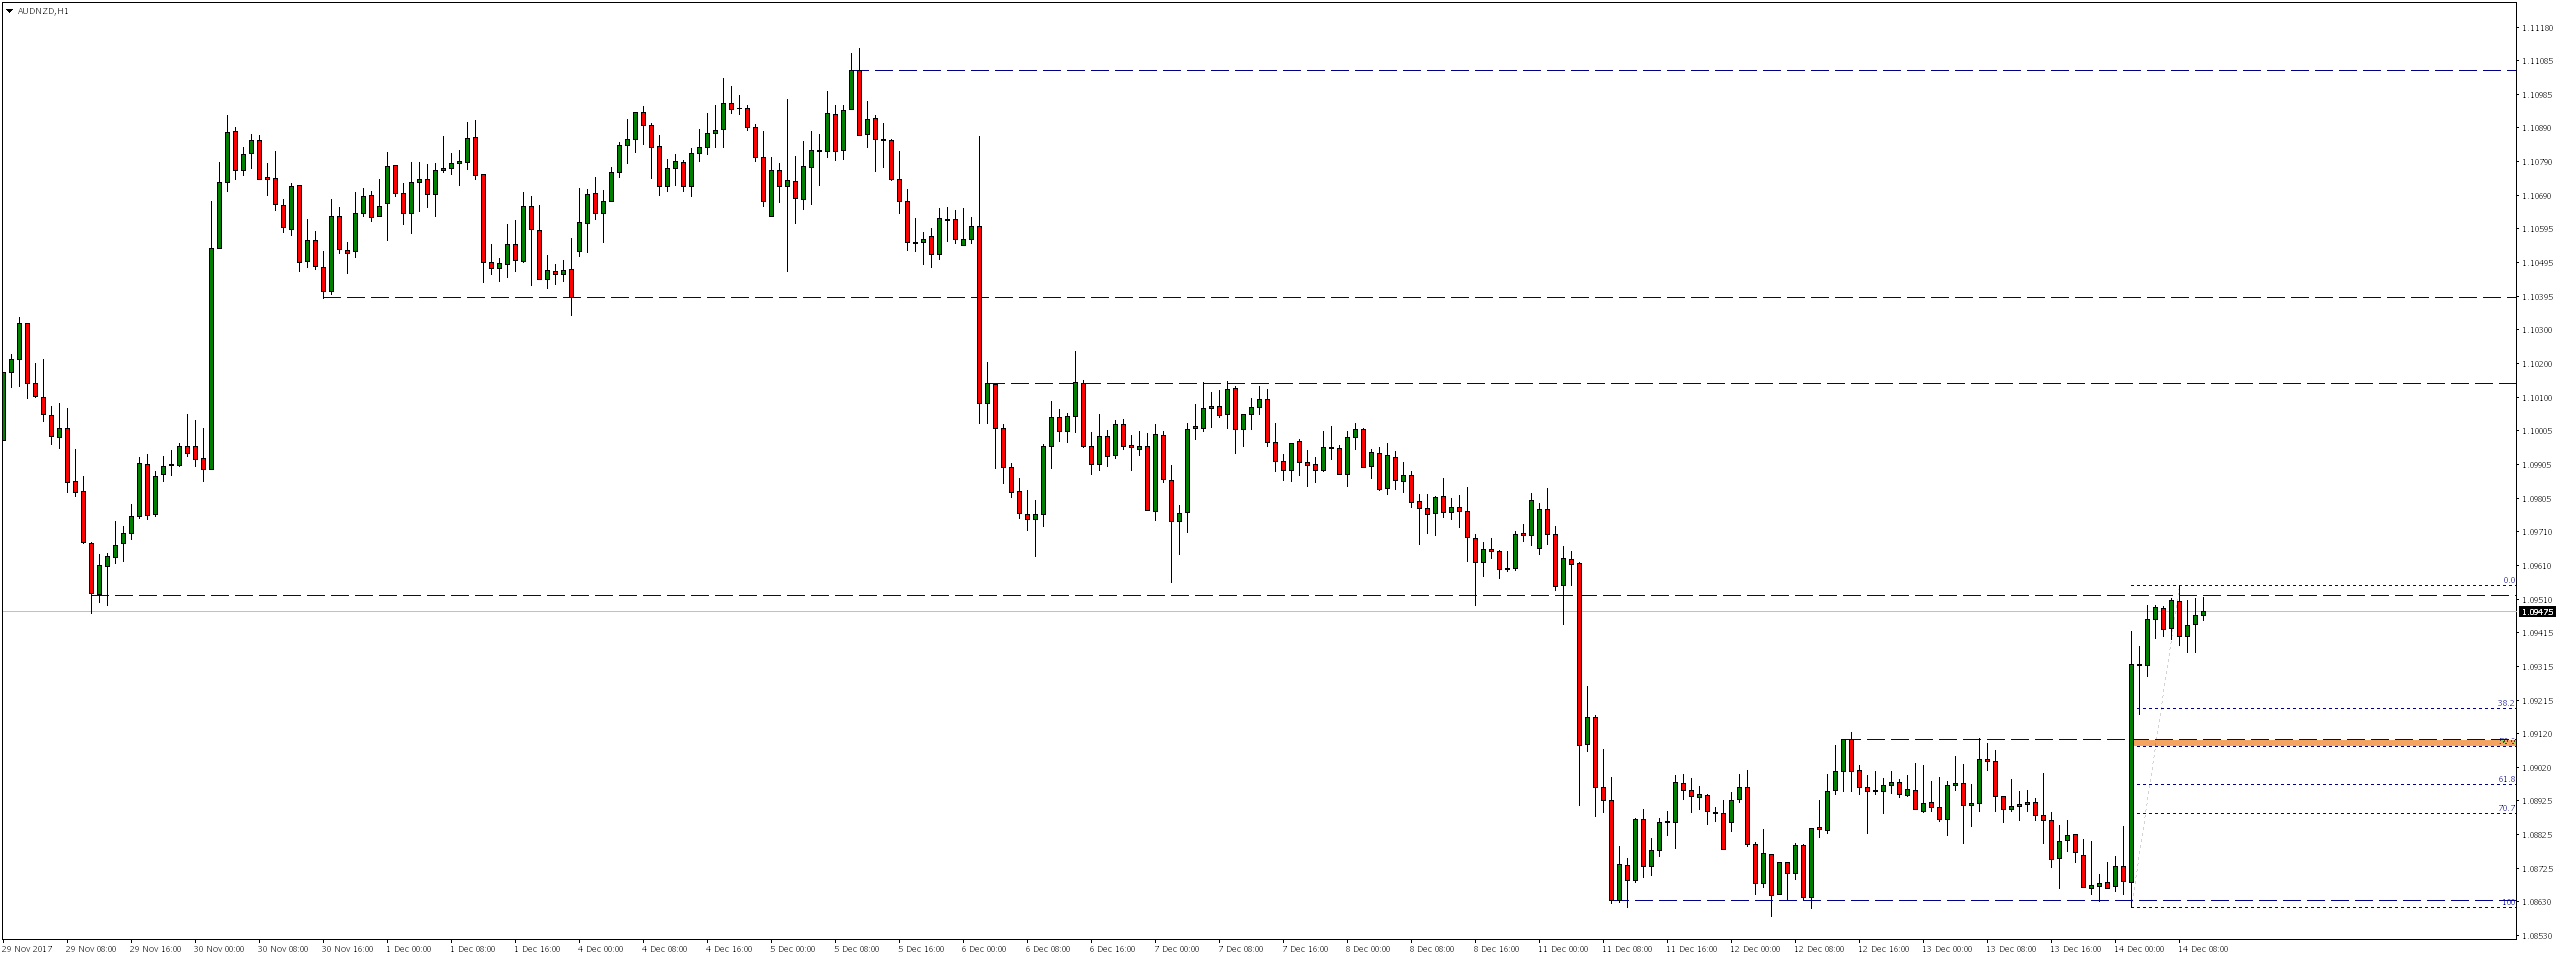
Looking at the H1 chart, we notice that due to these increases the rate reached the level of 1.0950. If this zone is defeated, the increases could be continued for at least another 60 pips.
Error, group does not exist! Check your syntax! (ID: 4)
Taking into account, however, that the market has not yet tested the resistance which has been overcome today (now support), we could expect at least a downward correction to take place.


 Review")


