![]()
![]() From Investor to Scalper – series of studies created in cooperation with broker BDSwiss, in which we take a financial instrument and the analysis includes a detailed look at the value from the monthly chart and ending with 5/15 minutes.
From Investor to Scalper – series of studies created in cooperation with broker BDSwiss, in which we take a financial instrument and the analysis includes a detailed look at the value from the monthly chart and ending with 5/15 minutes.
At the monthly chart we see that the copper market since the establishment of the historical highs of 4.625 in February 2011 moves south. As a result of these declines in November last year, we reached the area of the upward trendline and have since than a consolidation in the area.

On the weekly chart, we see that from the beginning of the year, the market creates a triangle formation. Given the recent rejection of the corrective uptrend line which is the lower limit of formation, in the near future we can expect growth and re-test of resistance zone between levels of 61.8% and 70.7% from the last bearish impulse and 38.2% of the entire decline.

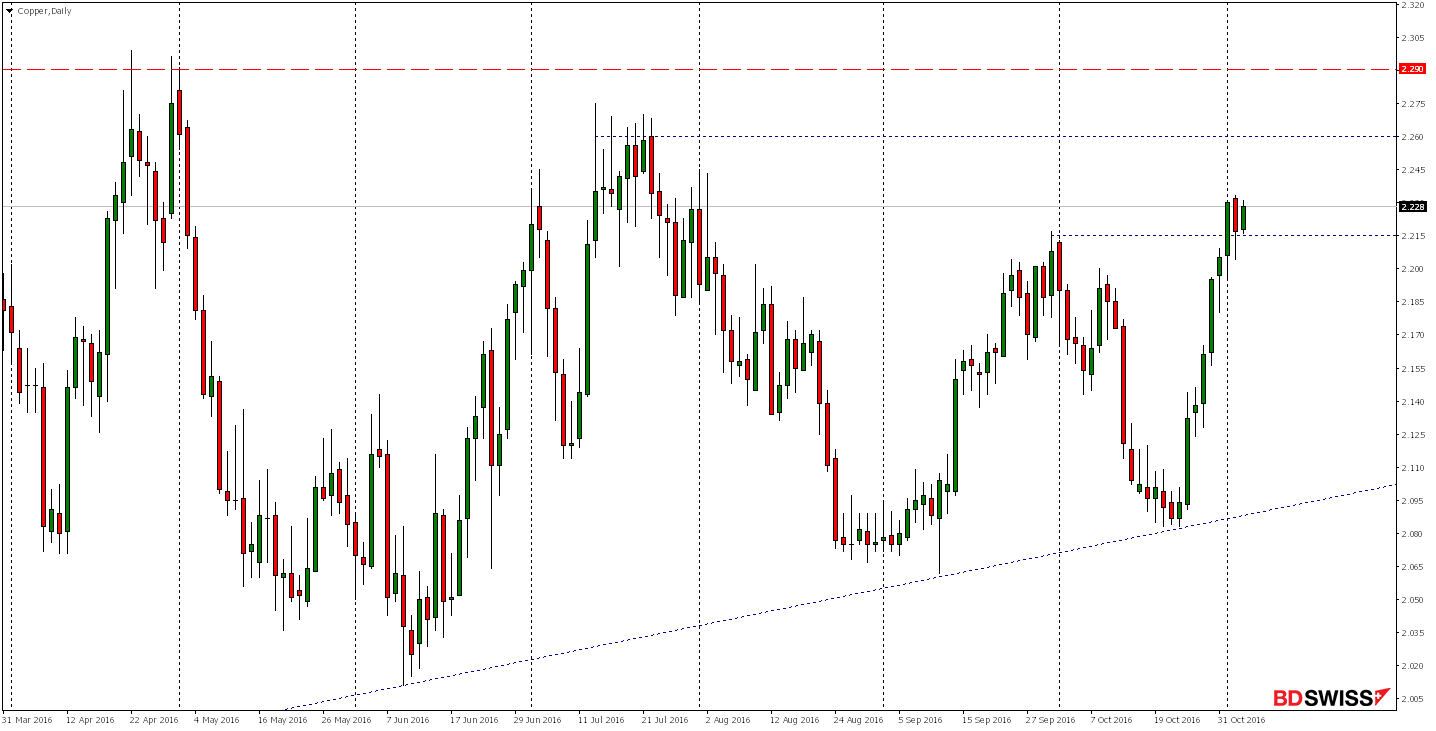
On daily chart for nearly two weeks we are seeing very dynamic growth, which on Tuesday defeated the resistance around 2215 by defeating the last high. Yesterday we saw a quick re-test and rejection of this level, and if in the near future we beat yesterday’s highs, the growth could be continued at levels around 2.260 or further 2.290.
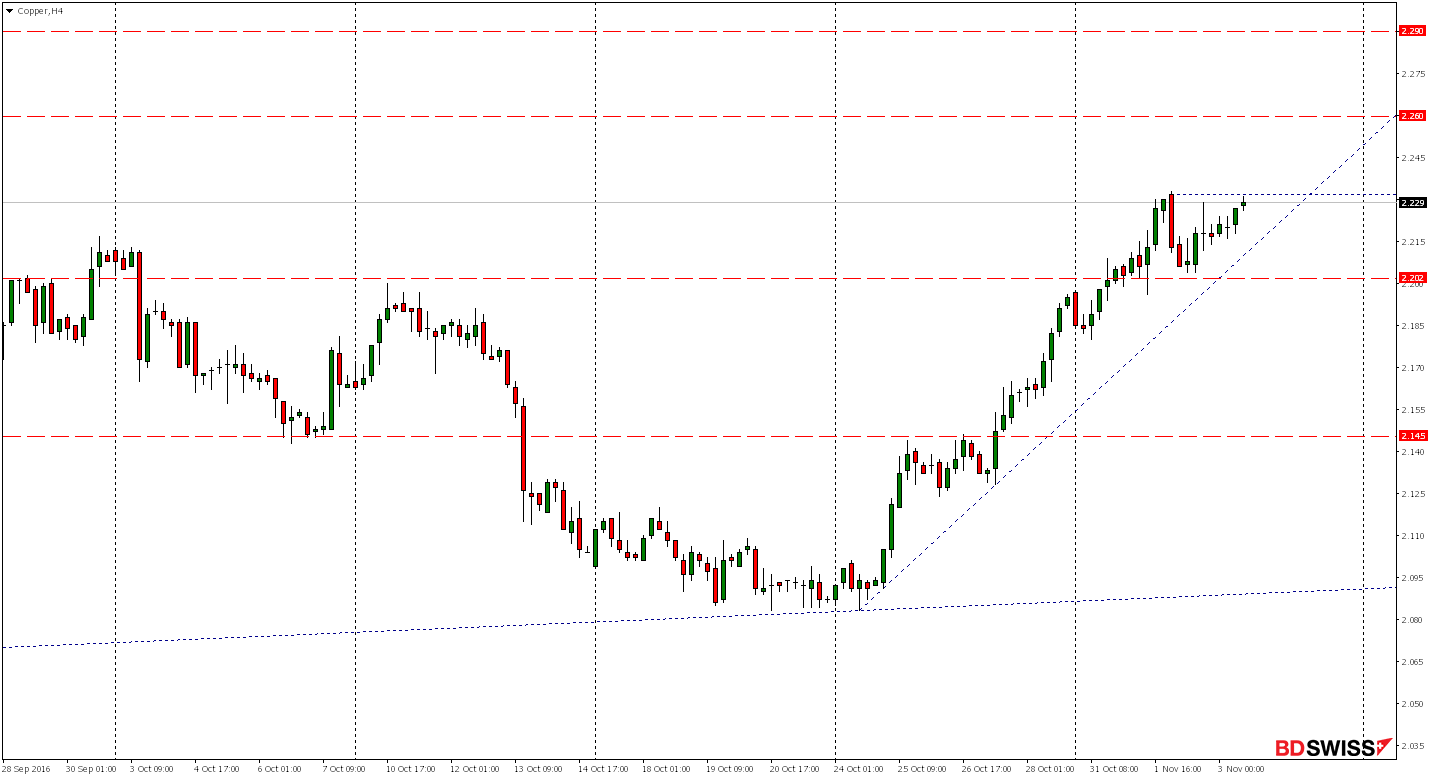
On H4 chart we can see that the market is now approaching yesterday’s highs but taking into account the ongoing weak dynamics of yesterday gains we expect emergence of a stronger response from supply.
On the graph H1 appeared just doji candle which is a sign of weakening of demand. Because it is in the area of local resistance, in the near future we can expect at least a small bearish correction.
On M15 chart, we see that if the supply wants to push down price a little , the potential reach for the declines appear to be around the growth trend line or further level of 2,200.


 Review")


