![]()
![]() From Investor to Scalper – series of studies created in cooperation with broker BDSwiss, in which we take a financial instrument and the analysis includes a detailed look at the value from the monthly chart and ending with 5/15 minutes.
From Investor to Scalper – series of studies created in cooperation with broker BDSwiss, in which we take a financial instrument and the analysis includes a detailed look at the value from the monthly chart and ending with 5/15 minutes.
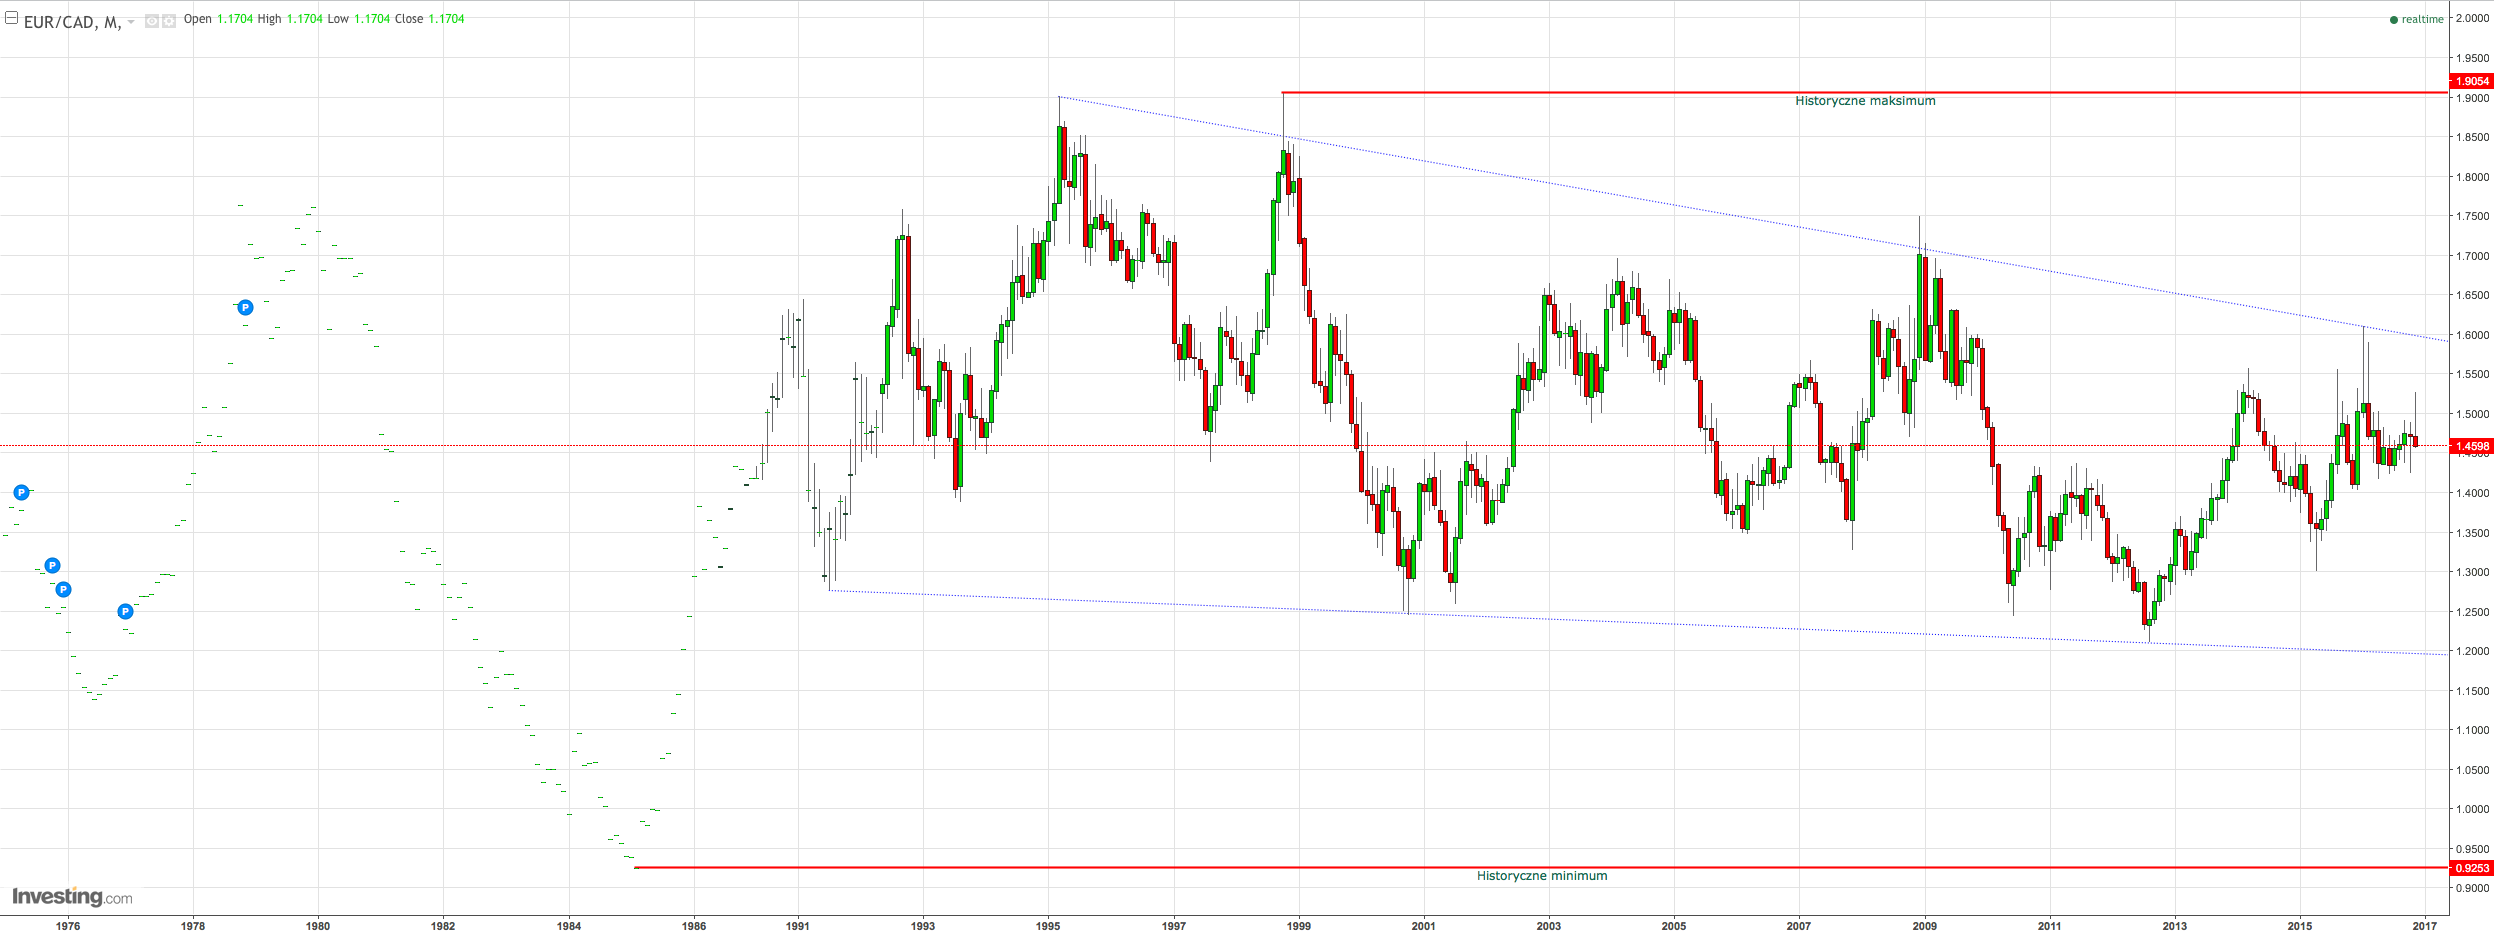
EURCAD currency pair since the very beginning of their trading, moves in 25 years consolidation within which creates a downward wedge. Following the rejection at the beginning of the year of upper limit of this formation we observe declines, which from a technical point of view could reach even to the vicinity of its lower limit.
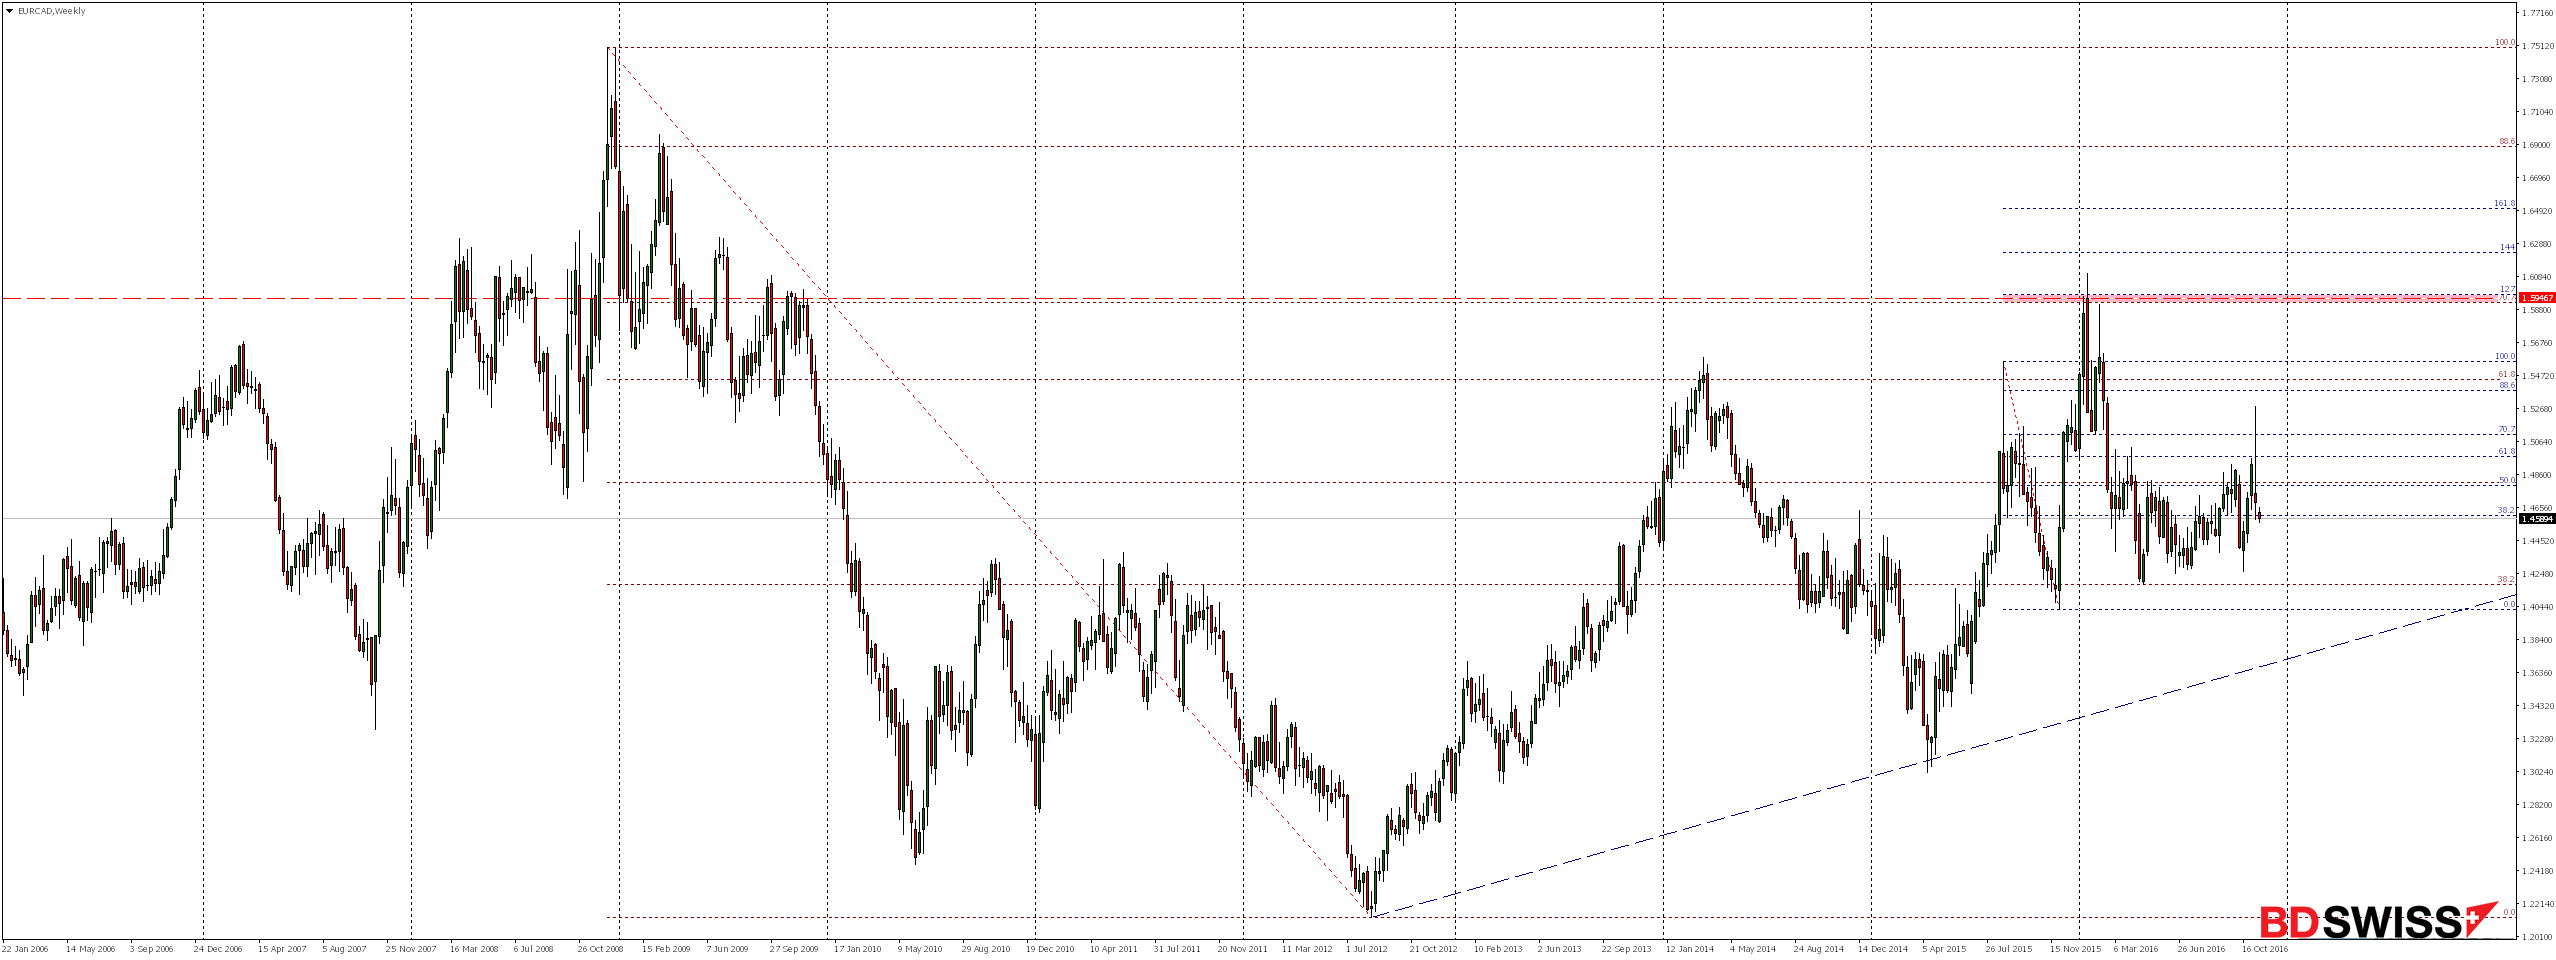
Looking at the weekly chart, we see that a strong supply response came as a result of the rejection of the level of 70.7% Fibonacci correction of the earlier declines and 127% of external measurement prior bearish correction .
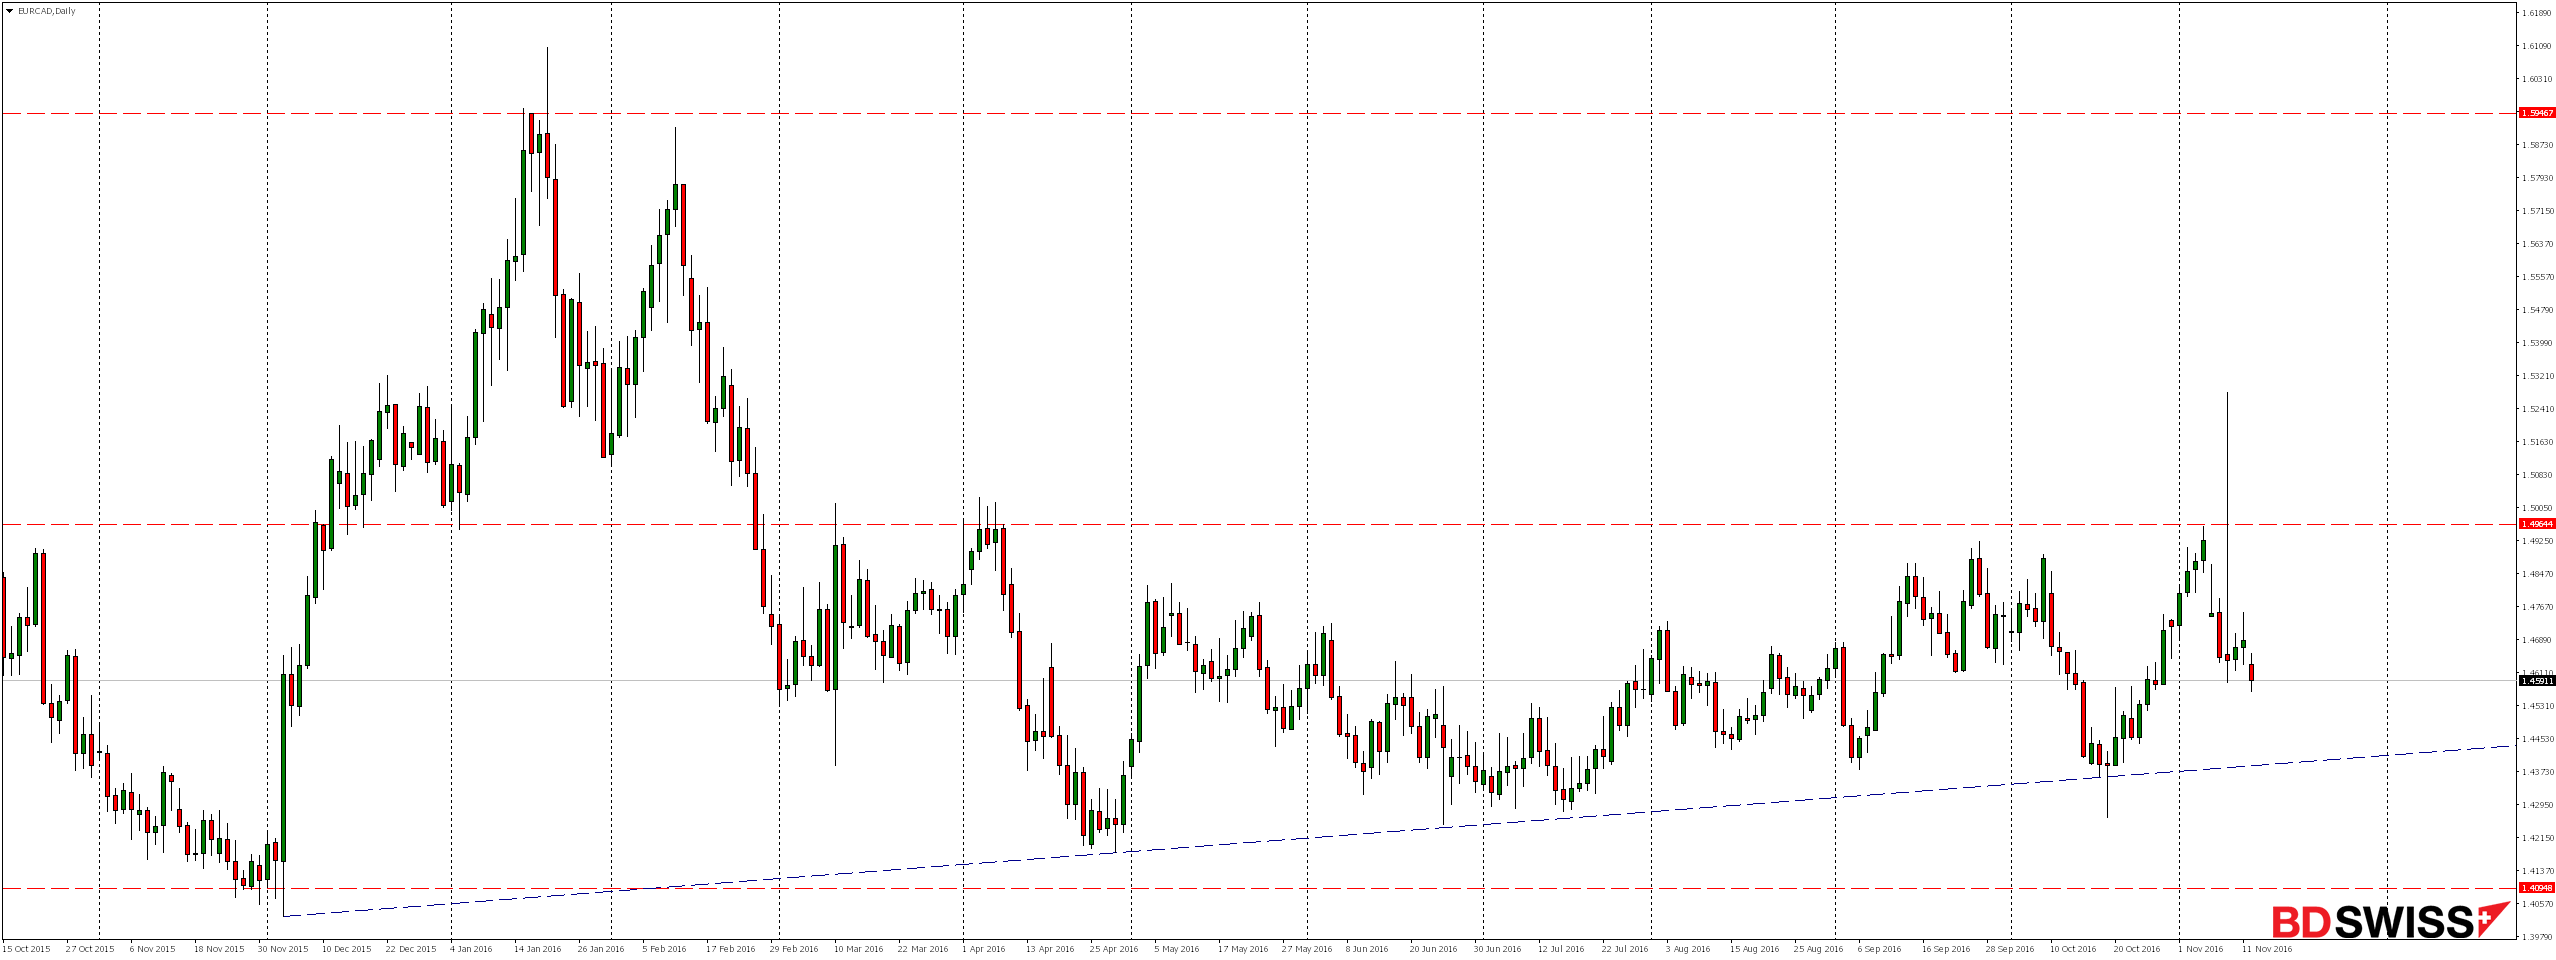
On daily chart for almost nine months we observe sideways movement, where the lower limit is the line of upward trend and in the near future we expect it be retested.
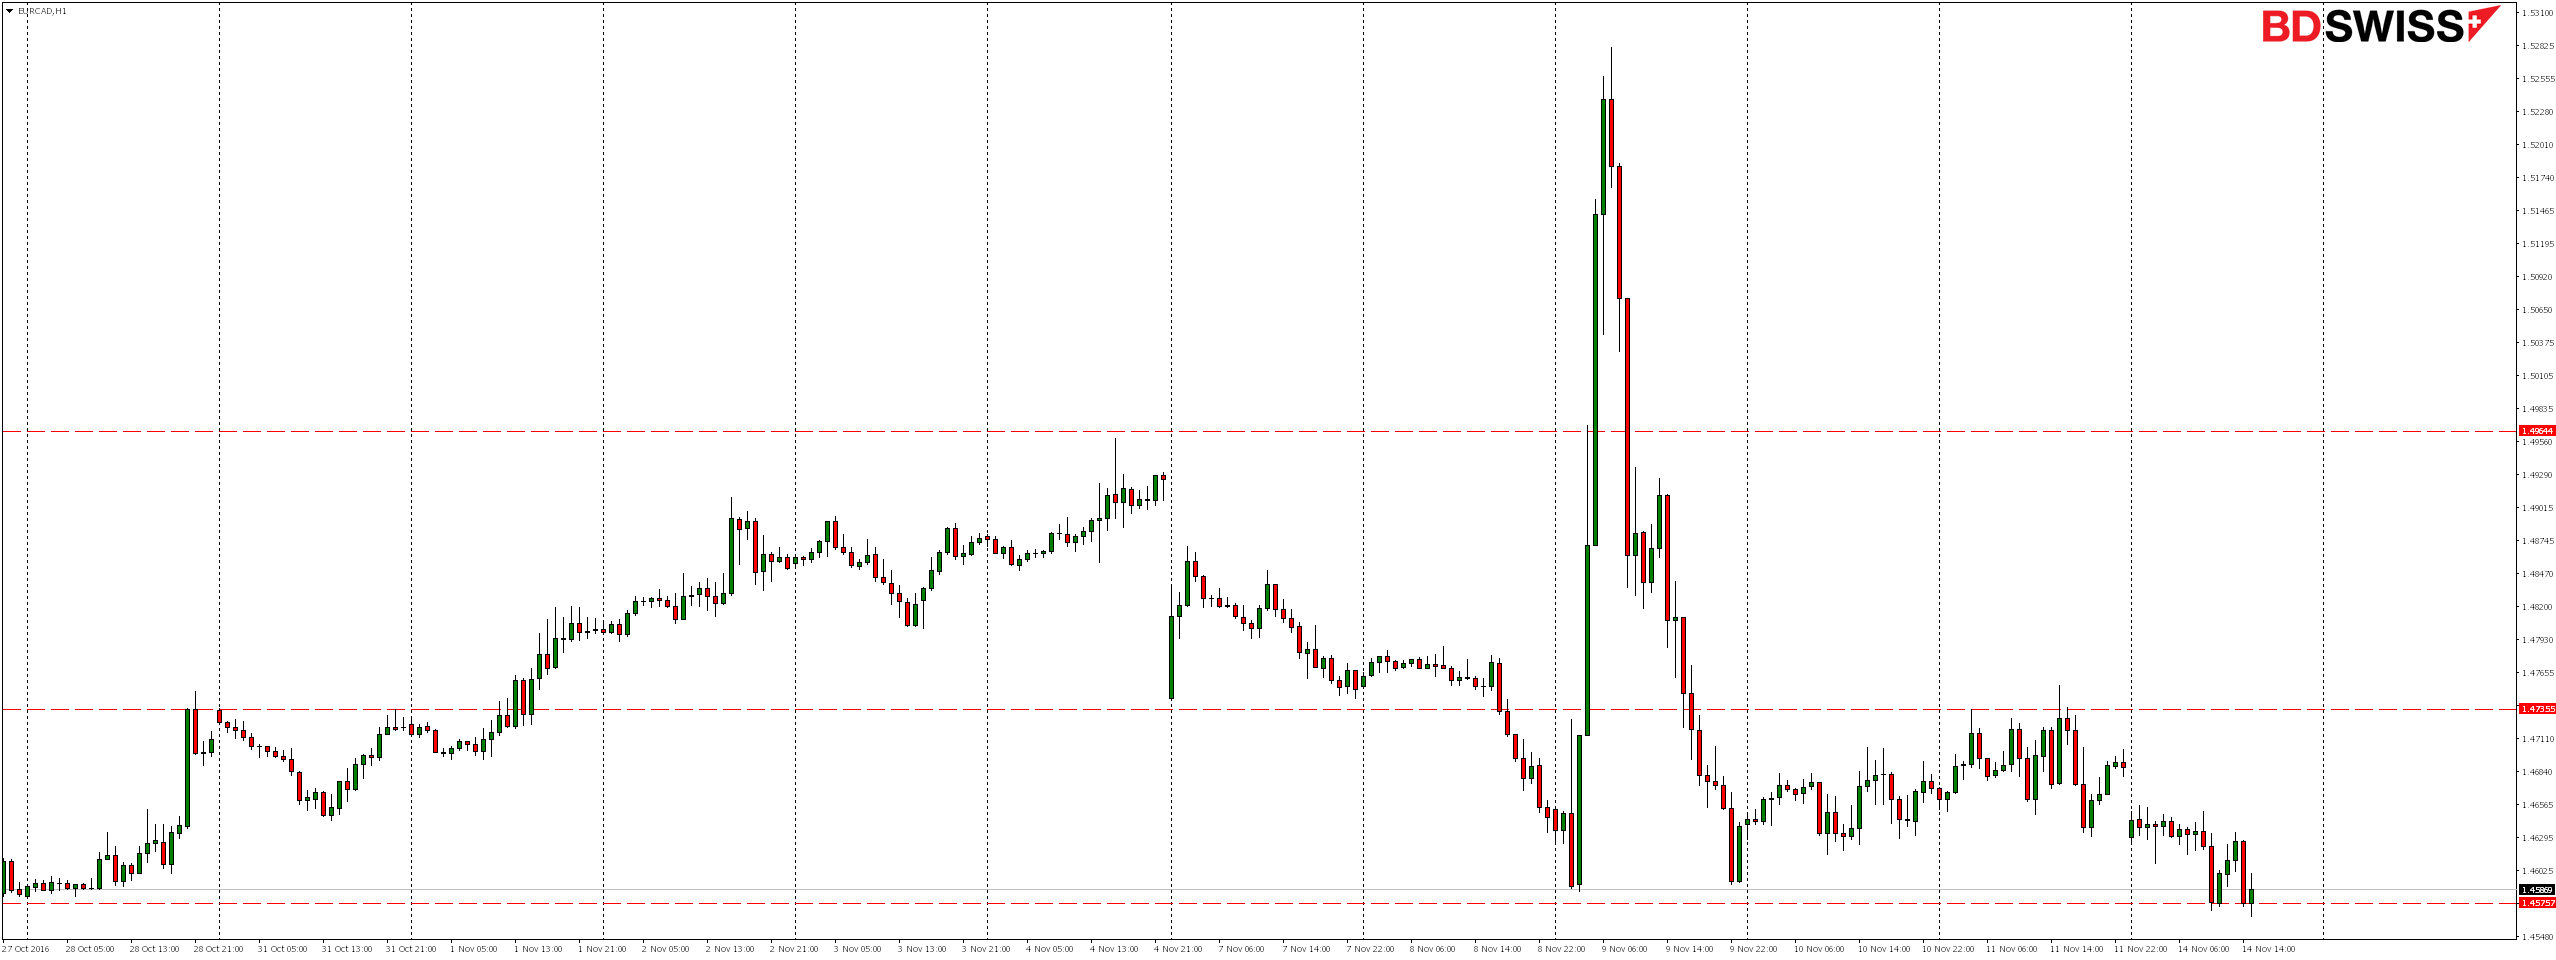
With the results of the first survey on the election results in the US, on the night of Tuesday to Wednesday we observed a strong depreciation of the Canadian dollar relative to the Euro which resulted in EURCAD growth of close to 700 pips.
After the announcement of the official results and the speech of the new president – Donald Trump, who calmed saying that he intends to be the president of all Americans and called for help, and joint activities not only his supporters but also opponents, the markets very quickly accepted this information as a result of which the situation began to stabilize by what we saw as dynamic drop, due to which the currency pair EURCAD returned to the levels before the elections.
Looking at the chart H4, we could say that really, the elections have now small impact on markets as we see everything is ‘back to normal’. We are now in the area of local support 1.4580, and only overcome of this level could open the way for further declines.

At the H1 chart for three days we have seen consolidation and only if demand rejects the current zone, then we can expect a re-test of the level 1.4735.
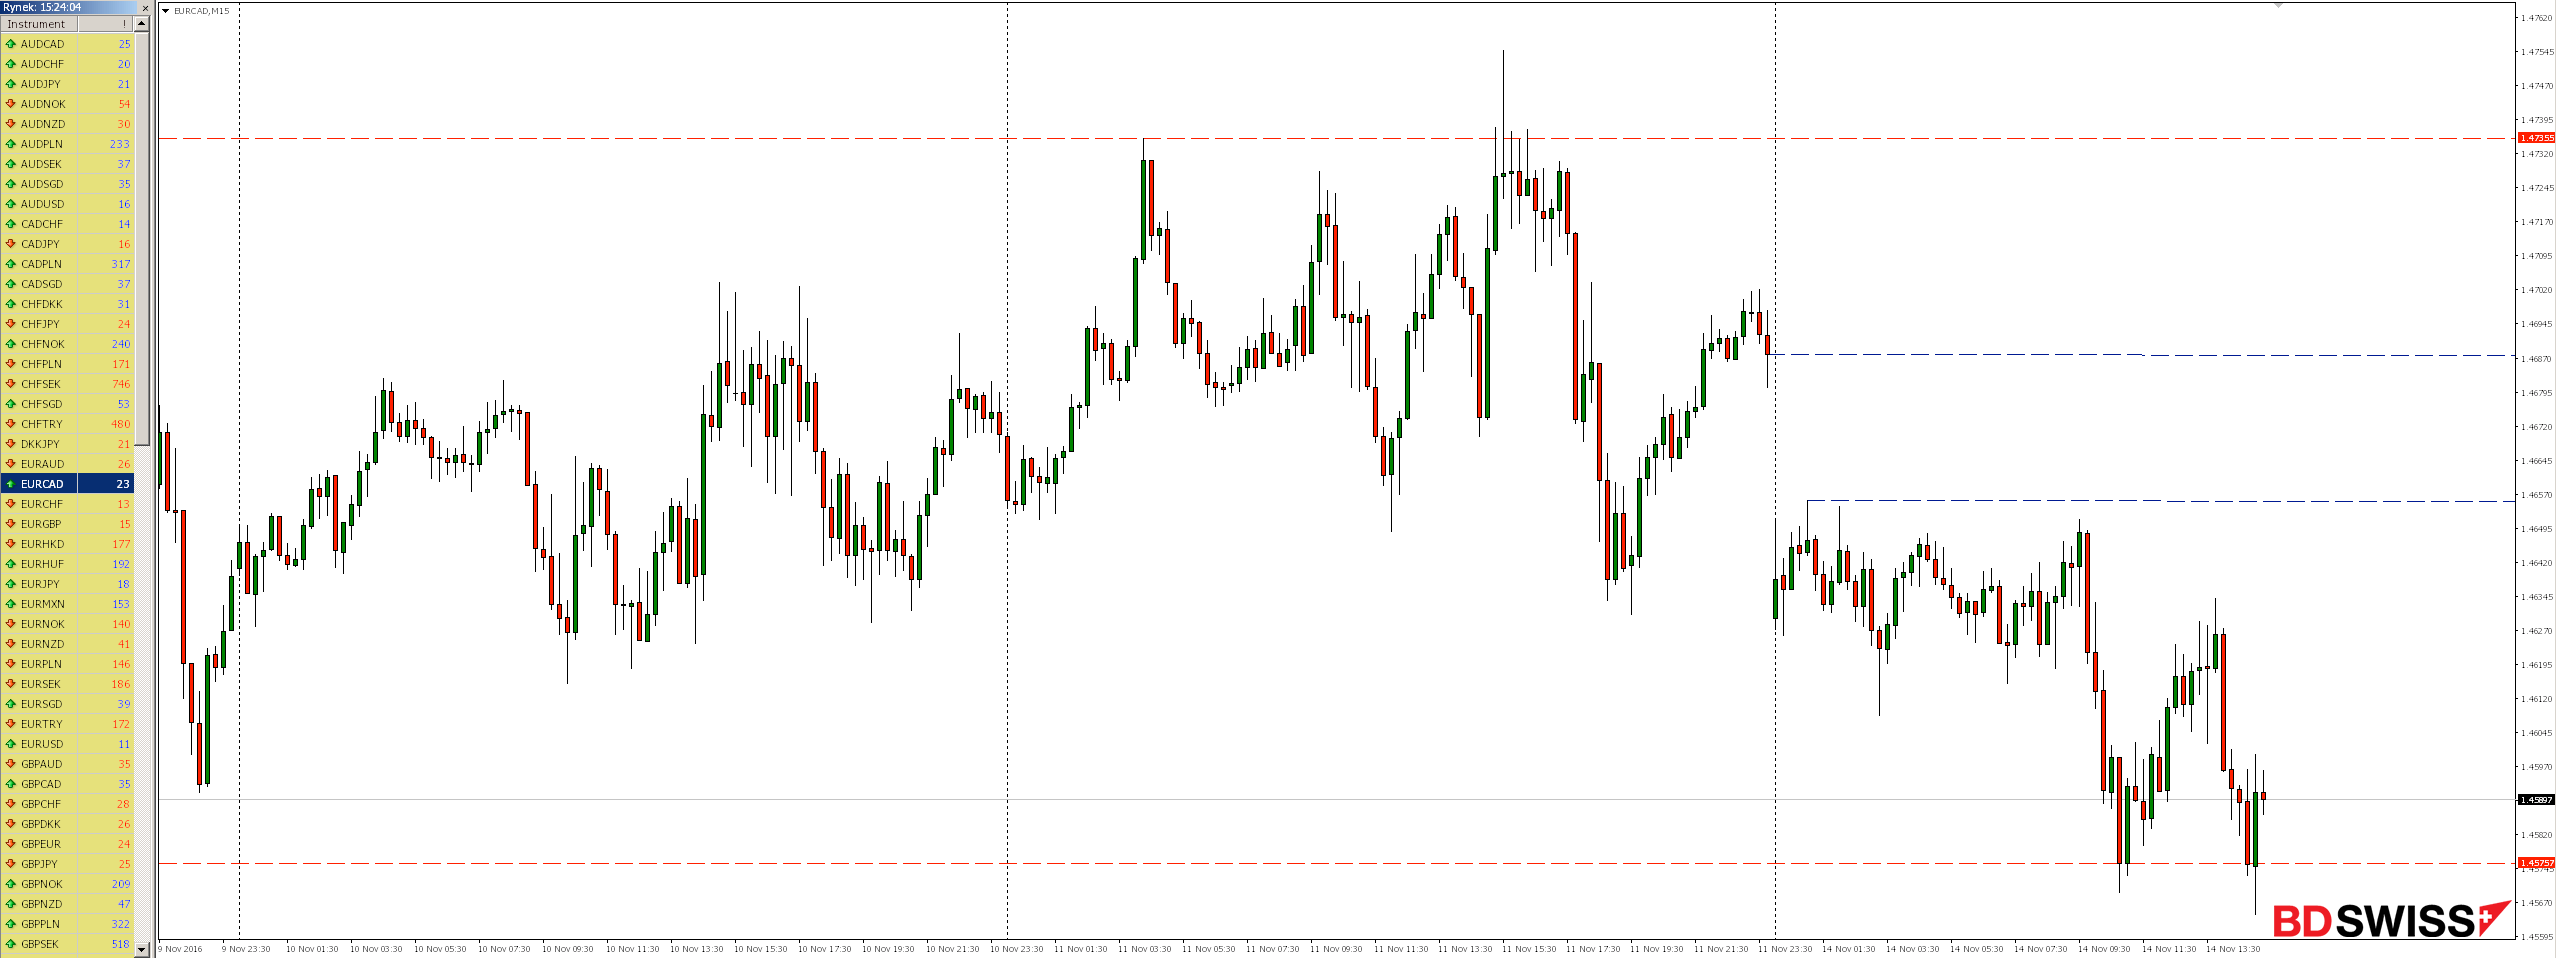
On the M15 chart we see the formation of double bottom rejecting the present support. For pro-bullish scenario could also speak that still remains uncompleted bearish weekend gap .
To invest both long and short-term recommend checking out the offer Broker BDSwiss and use a low spread, which at the time of the creation of analysis EURCAD was 2.3 pips.


 Review")


