NZDJPY, after declines lasting from January 2015, reached in June very important support at 69.00 converging with 50% Fibonacci correction from previous six-year growth, where demand response appeared.
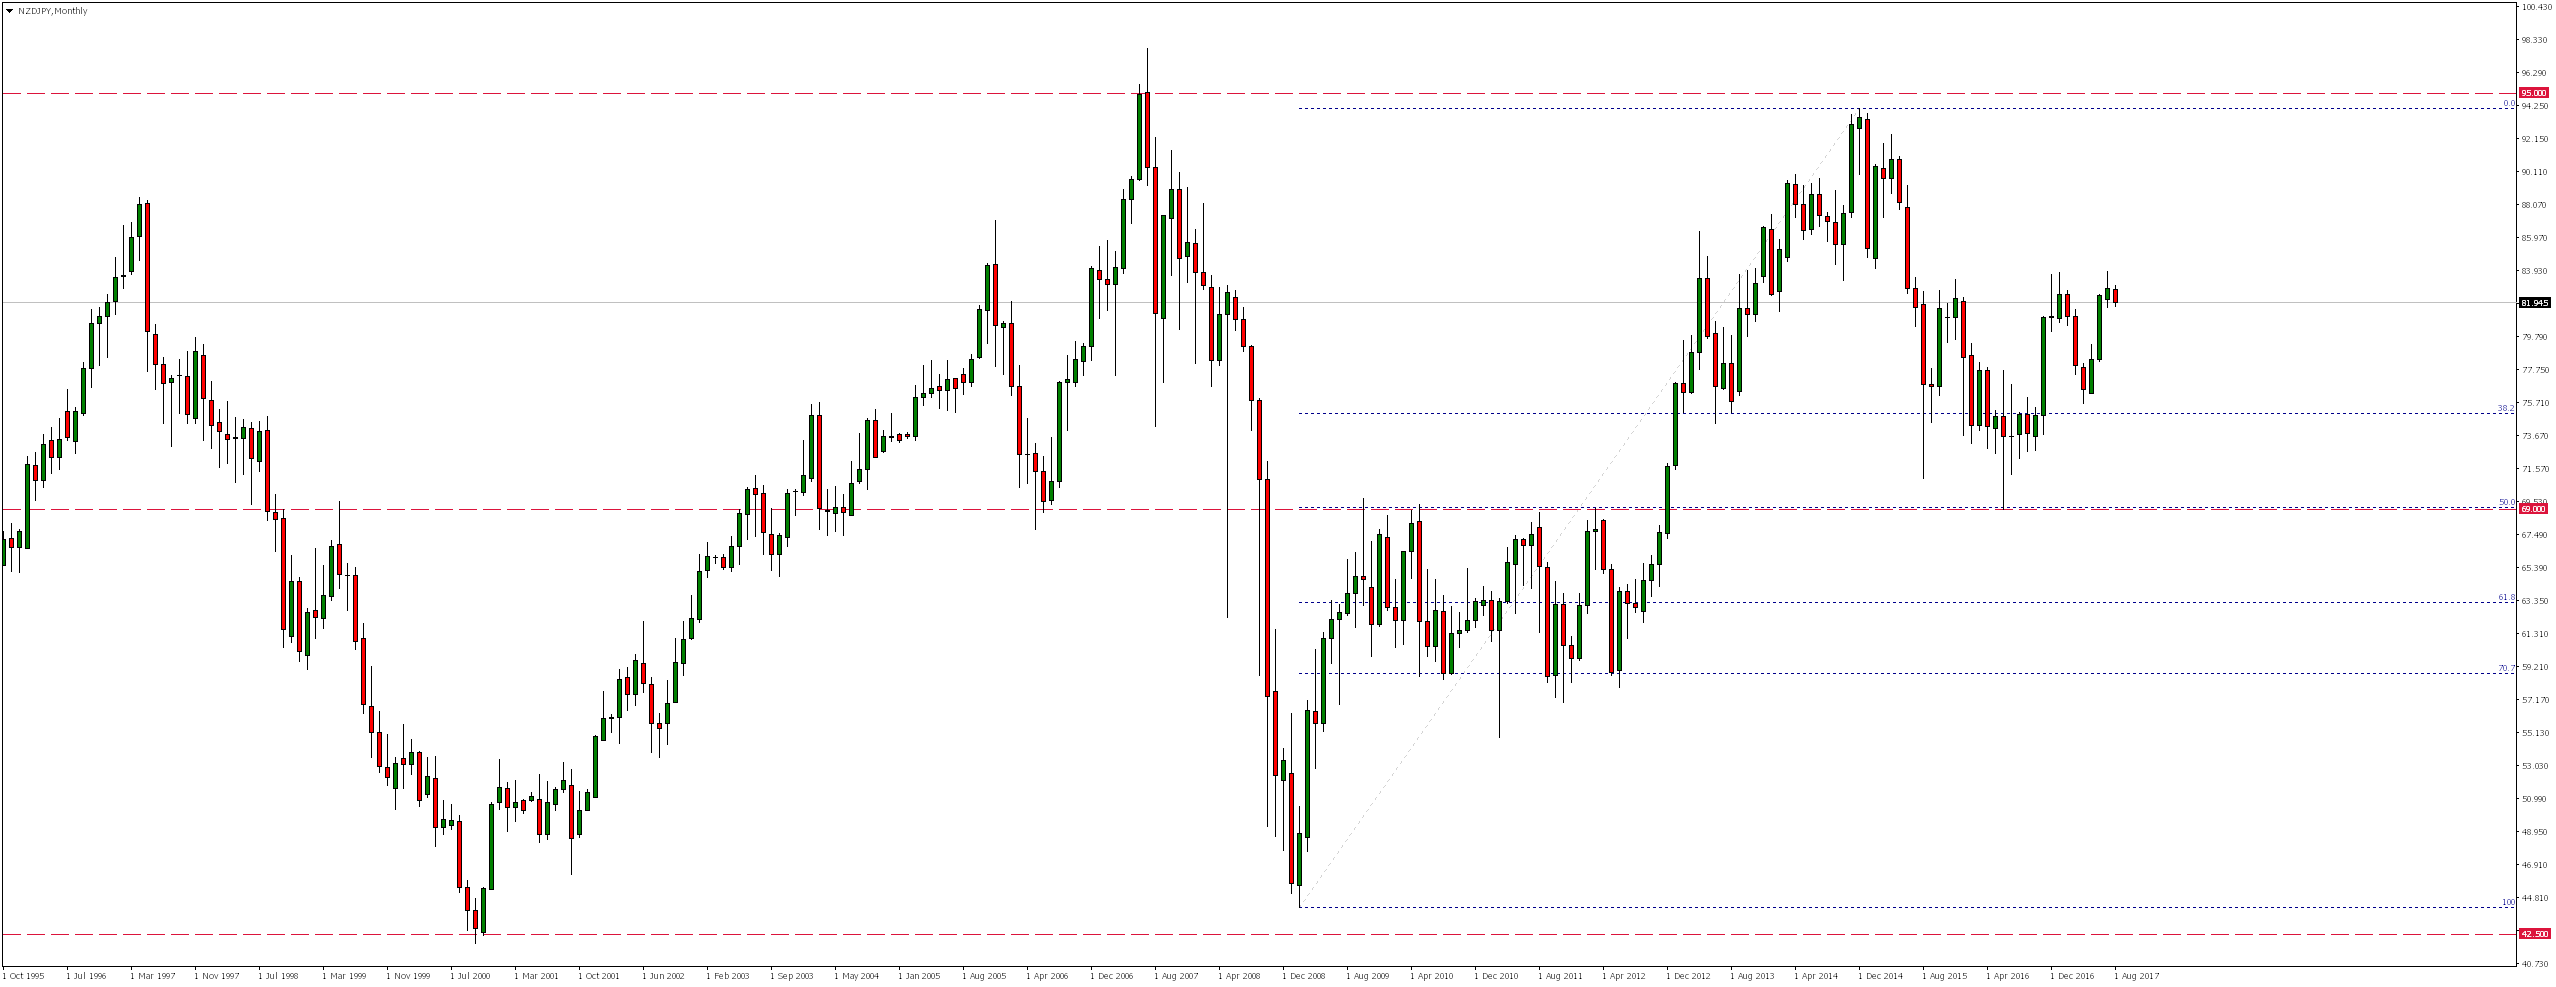
Later growth reached vicinity of 83.30, where in November 2016,January and July this year. supply reactions have occurred. If this time this level is permanently discarded (and all points to this), we may expect return to declines.
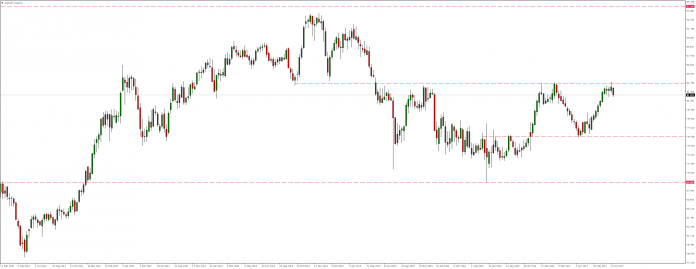
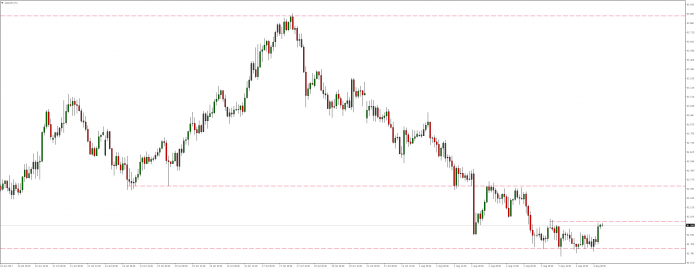
On daily chart we will see that if this trend continues, potential drops could even reach lows from April equal to 75.80.
However, for this scenario could have been realized, we would have to first overcome local support at 81.75. It is only after defeating this level price will create a bearish sequence of lower lows.
Error, group does not exist! Check your syntax! (ID: 4)
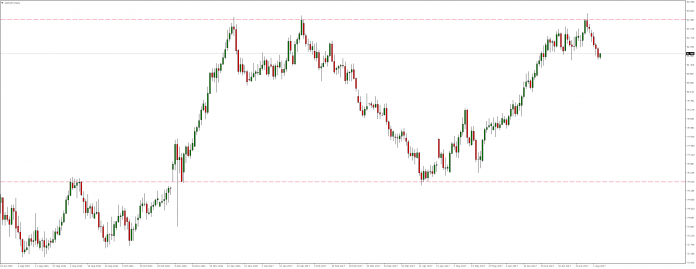
So if currently tested local resistance will be broken, we would expect deepening of upward correction even to level 82.30. However, it does not change the fact that in longer time horizon we could expect further declines.


 Review")


