![]()
![]() From Investor to Scalper – series of studies created in cooperation with broker BDSwiss, in which we take a financial instrument and the analysis includes a detailed look at the value from the monthly chart and ending with 5/15 minutes.
From Investor to Scalper – series of studies created in cooperation with broker BDSwiss, in which we take a financial instrument and the analysis includes a detailed look at the value from the monthly chart and ending with 5/15 minutes.
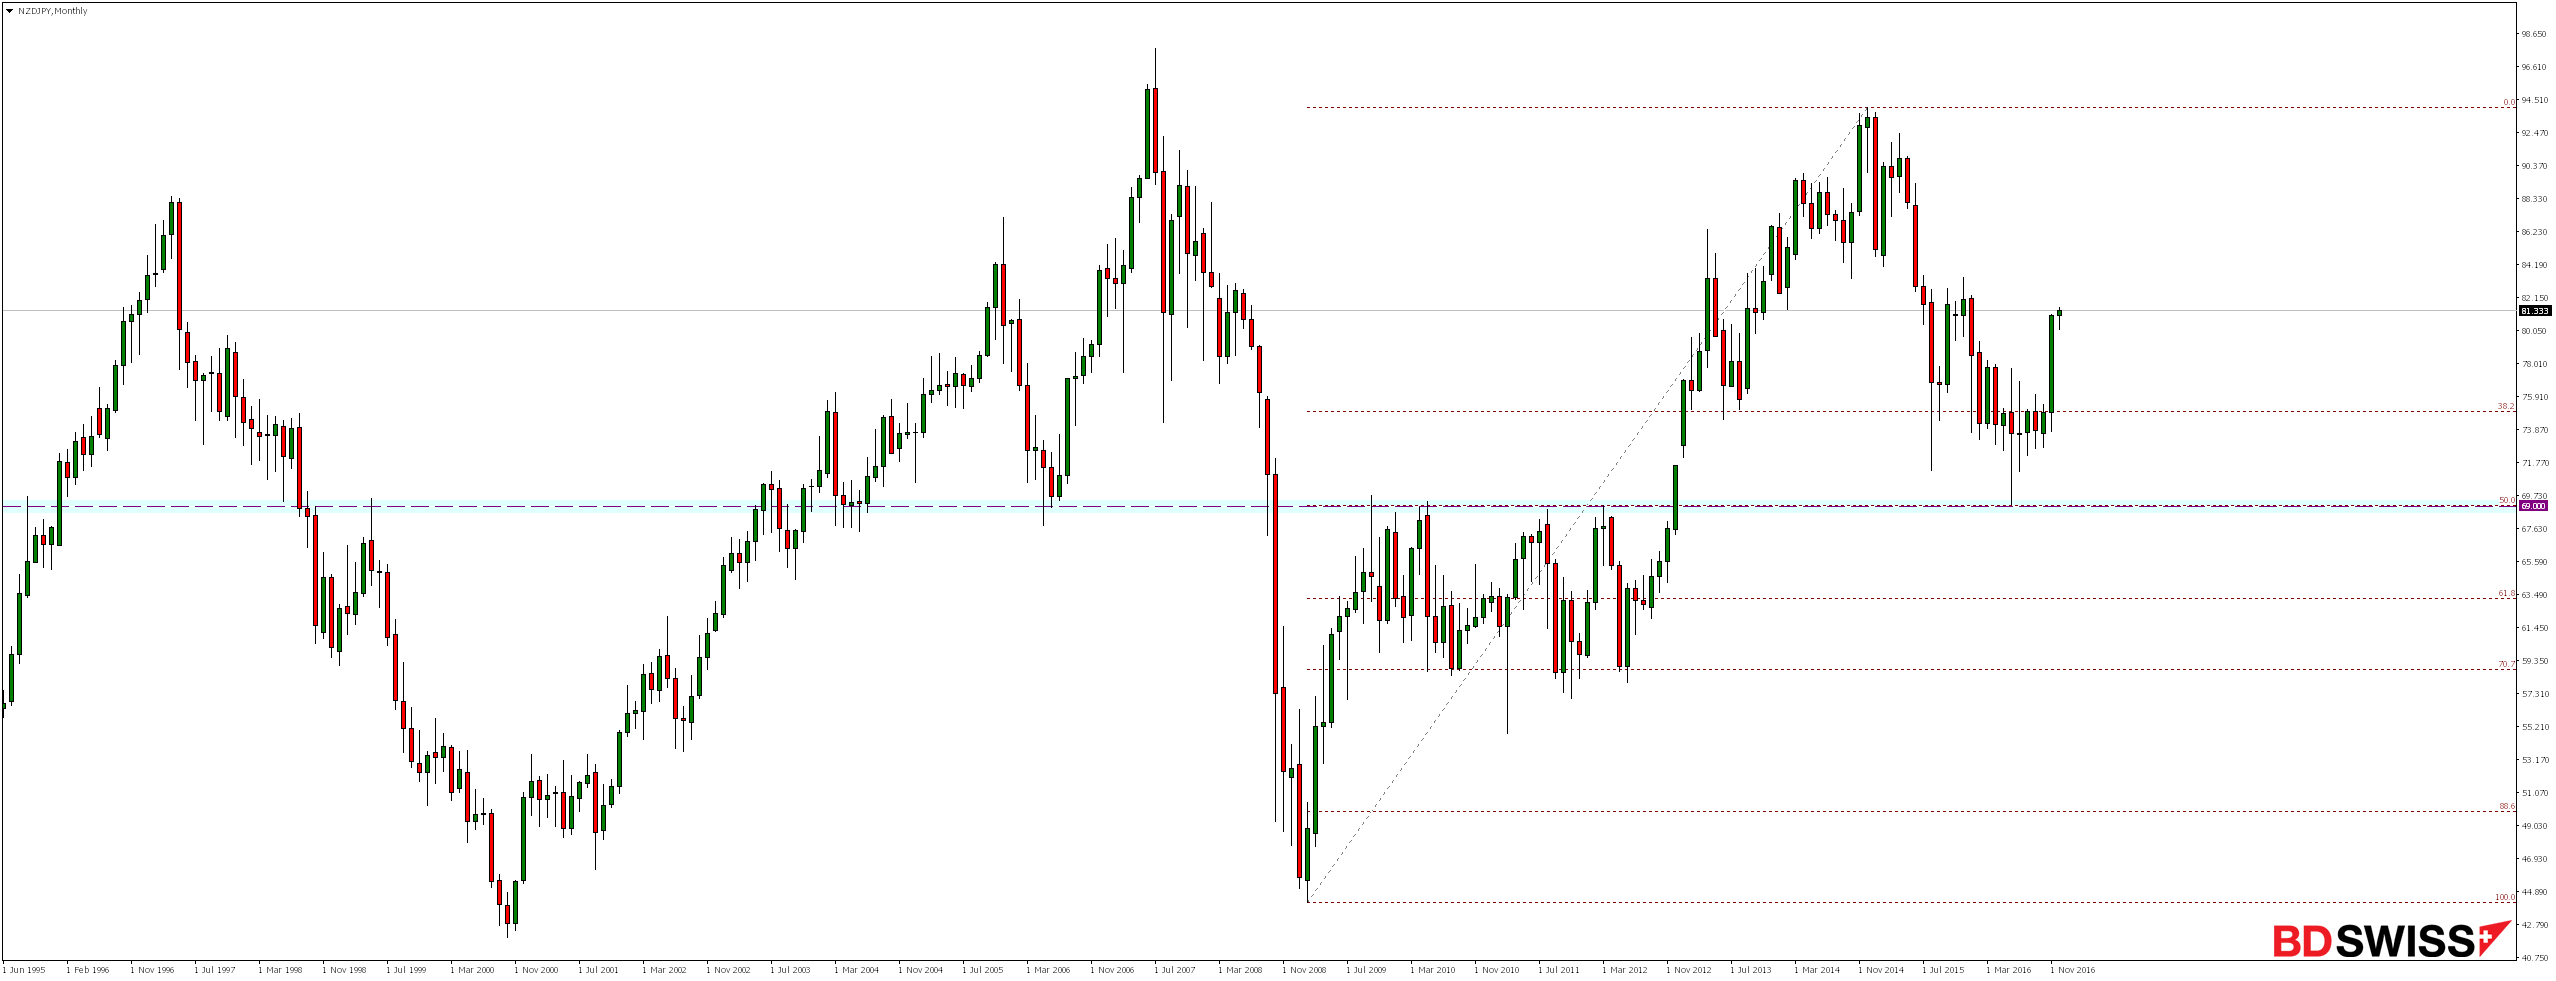
NZDJPY after declines lasting since January 2015 in June reached very important support around level 69.00 coinciding with 50% Fibonacci correction of the earlier over six-year increases. The rejection of this level resulted in gains which increased in November.
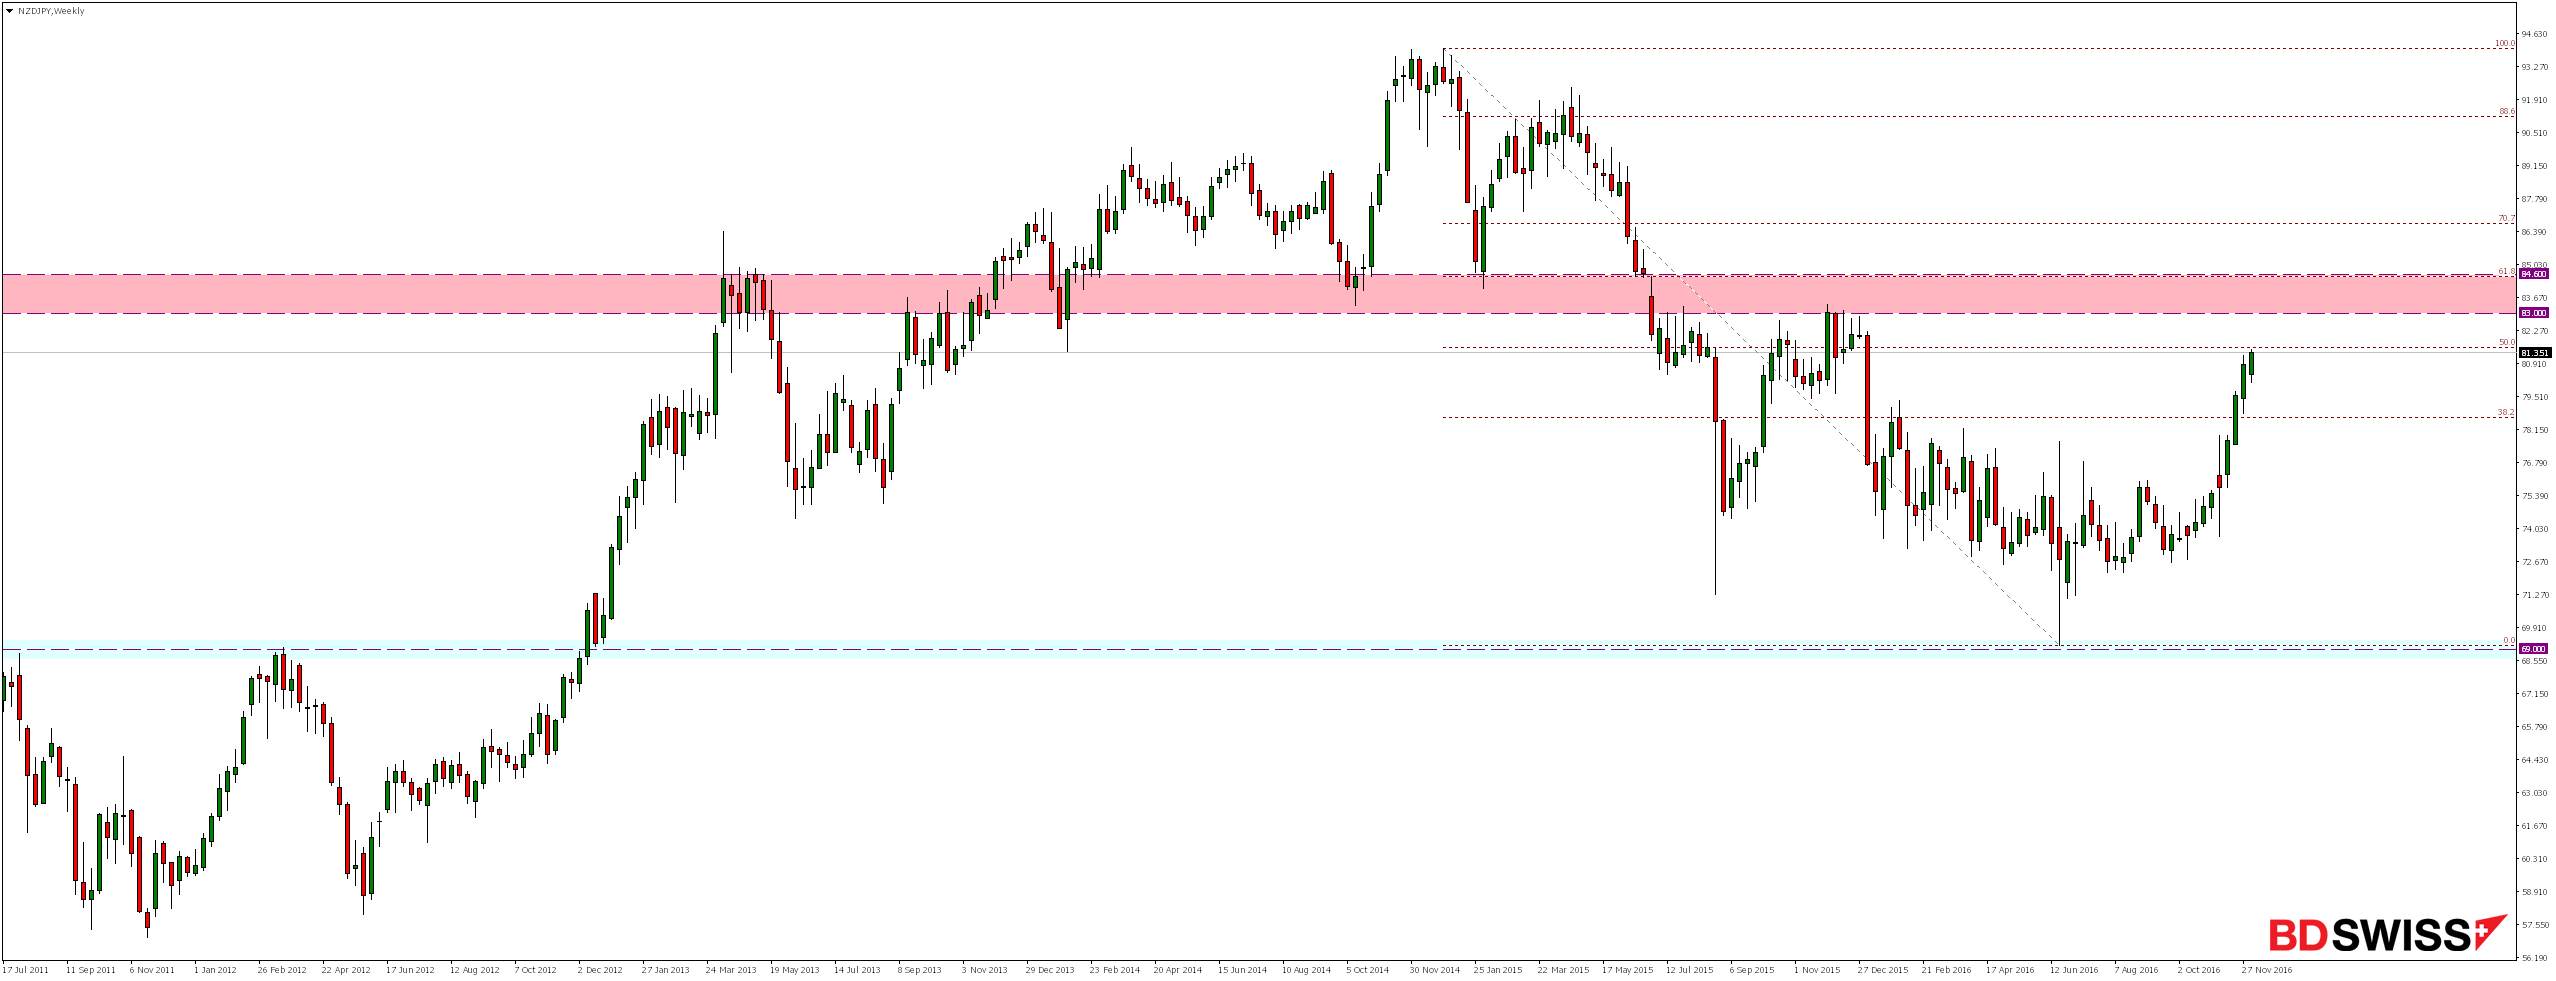
On weekly chart we see that market is currently around 50% of the momentum of these declines. From a technical point of view, gaincould be continued to around level of 83.00 or 84.60 coinciding with 61.8% Fibonacci level.
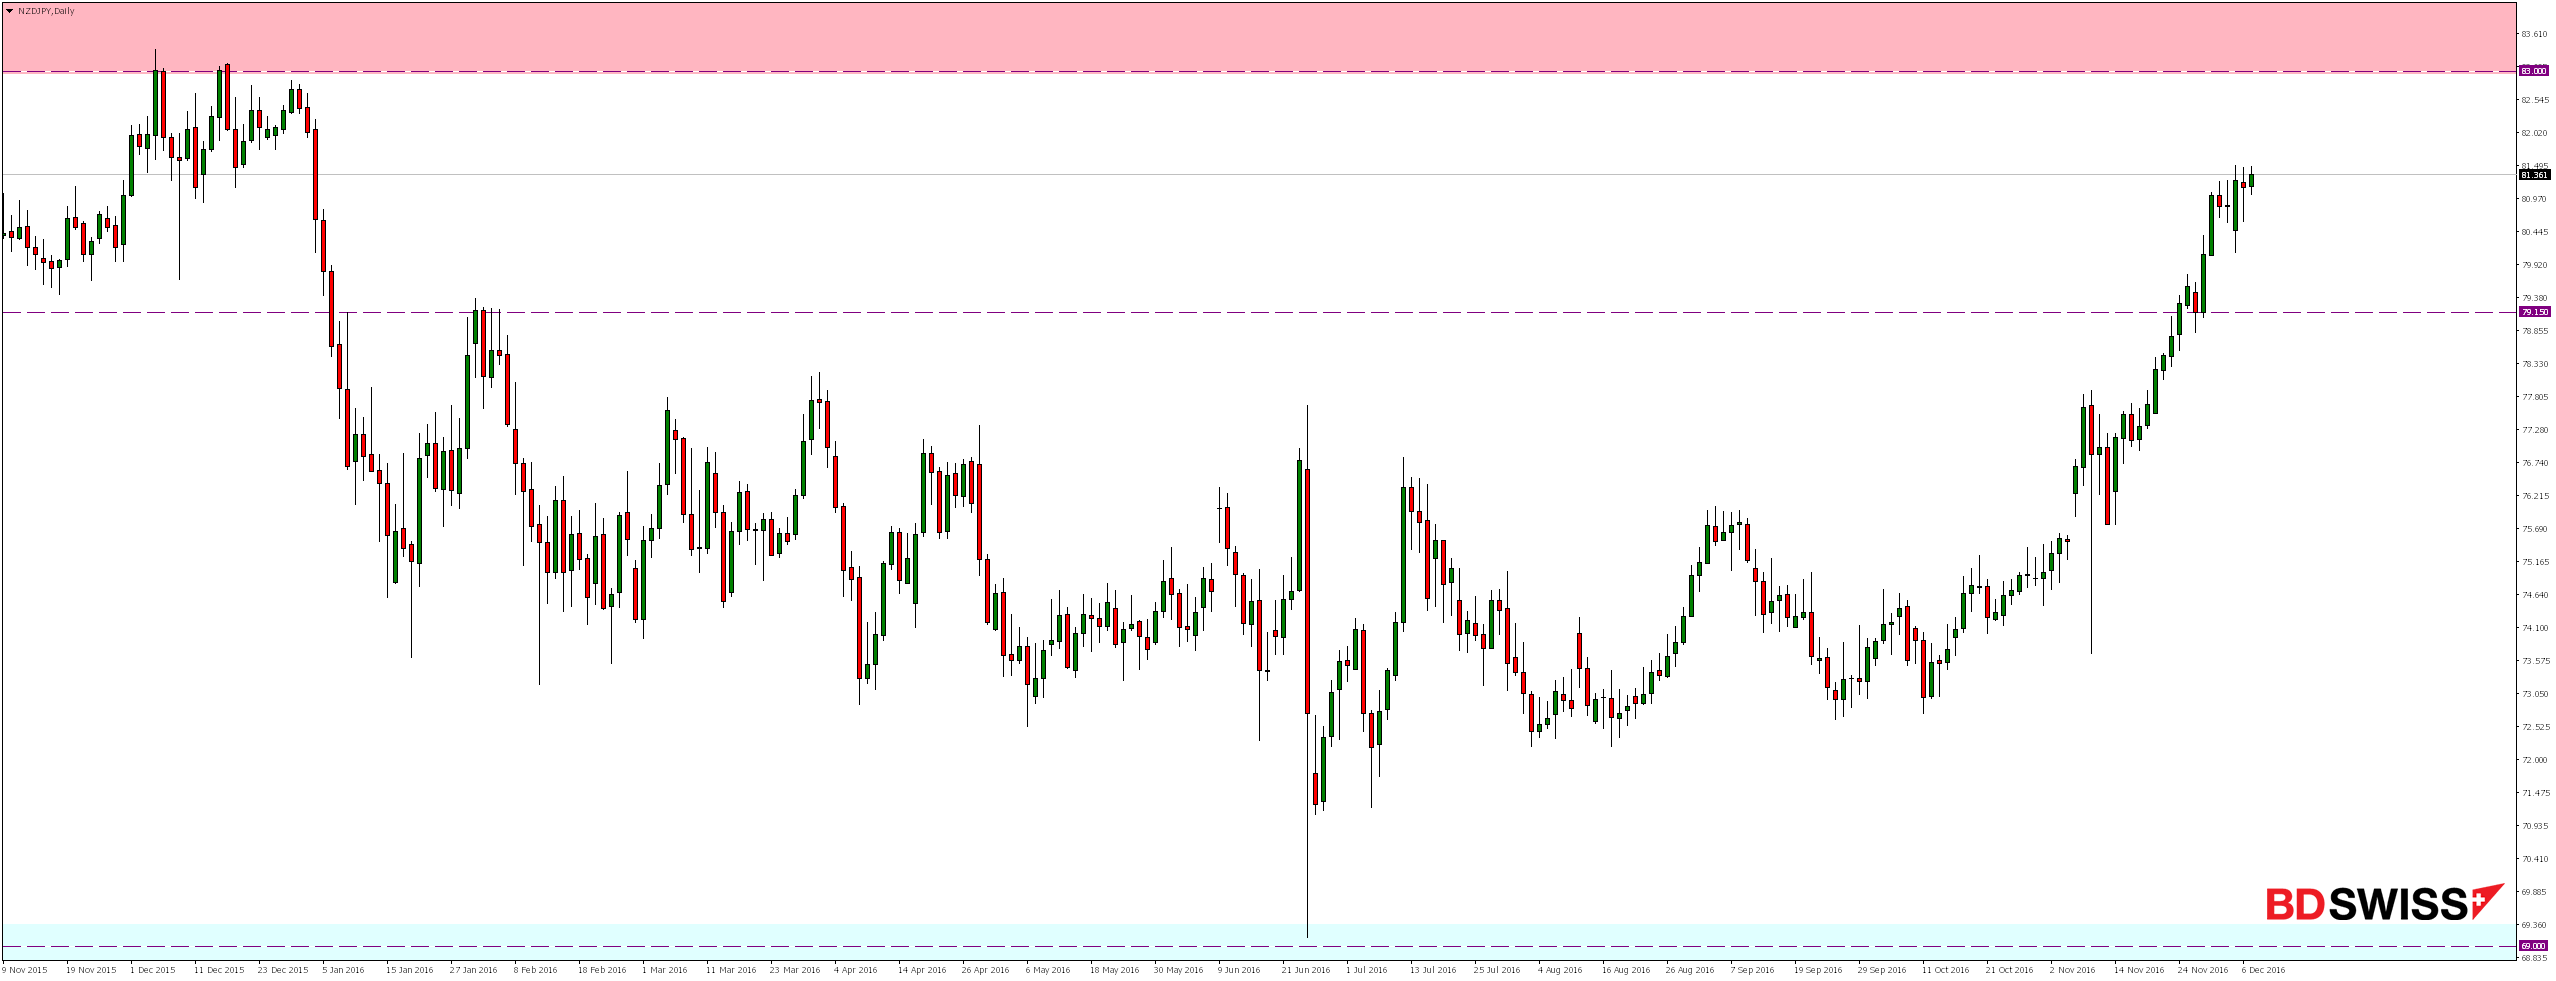
Looking on the daily chart we see that even if in near future there will be reaction of bears a potential drop could be only a correction re-testing defeated on November 24th this year level of 79.15.
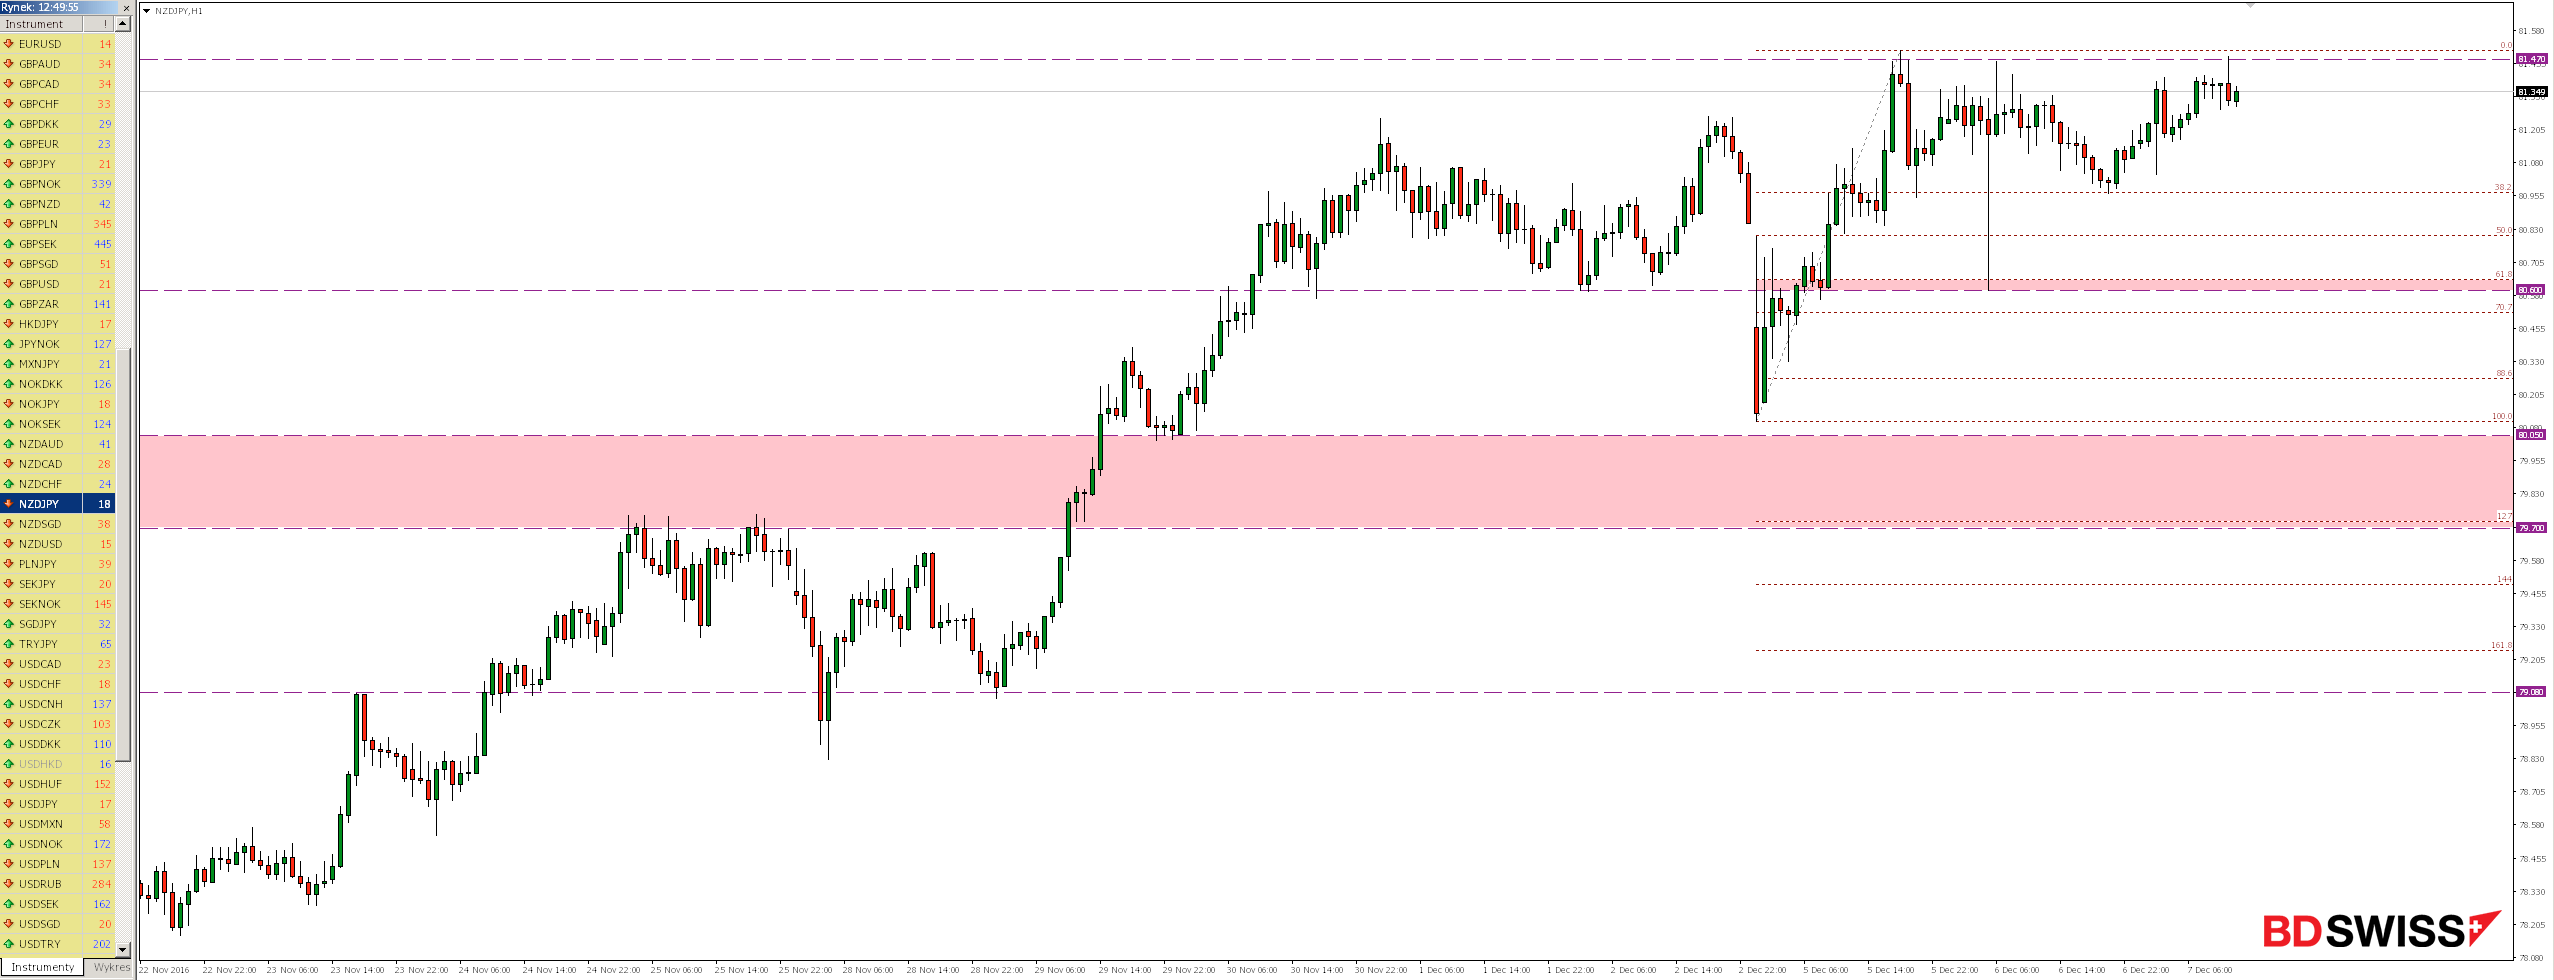
On the H1 chart we see that the market since Monday evening is oscillating around the level of 81.47. Defeat of it could pave the way for further gain. However, if this resistance will be rejected the nearest support turns out to be 38.2% Fibonacci correction coinciding with yesterday’s lows and further support zone around 80.60.
Use analysis to invest at the Broker BDSwiss, where at the time of the creation of the analysis the spread of NZDJPY was 1.8 pips.


 Review")


