The currency pair NZDCAD (New Zealand dollar to Canadian dollar) has been moving in an upward trend since March this year. In the period August-October the pair was in a narrowing consolidation which became triangular.
In November, there was a breakthrough from consolidation and the price is growing dynamically towards the supply zone at 0.9230.
- The bearish outside bar indicates an upcoming correction.
- NZDCAD sets a maximum of 2020.
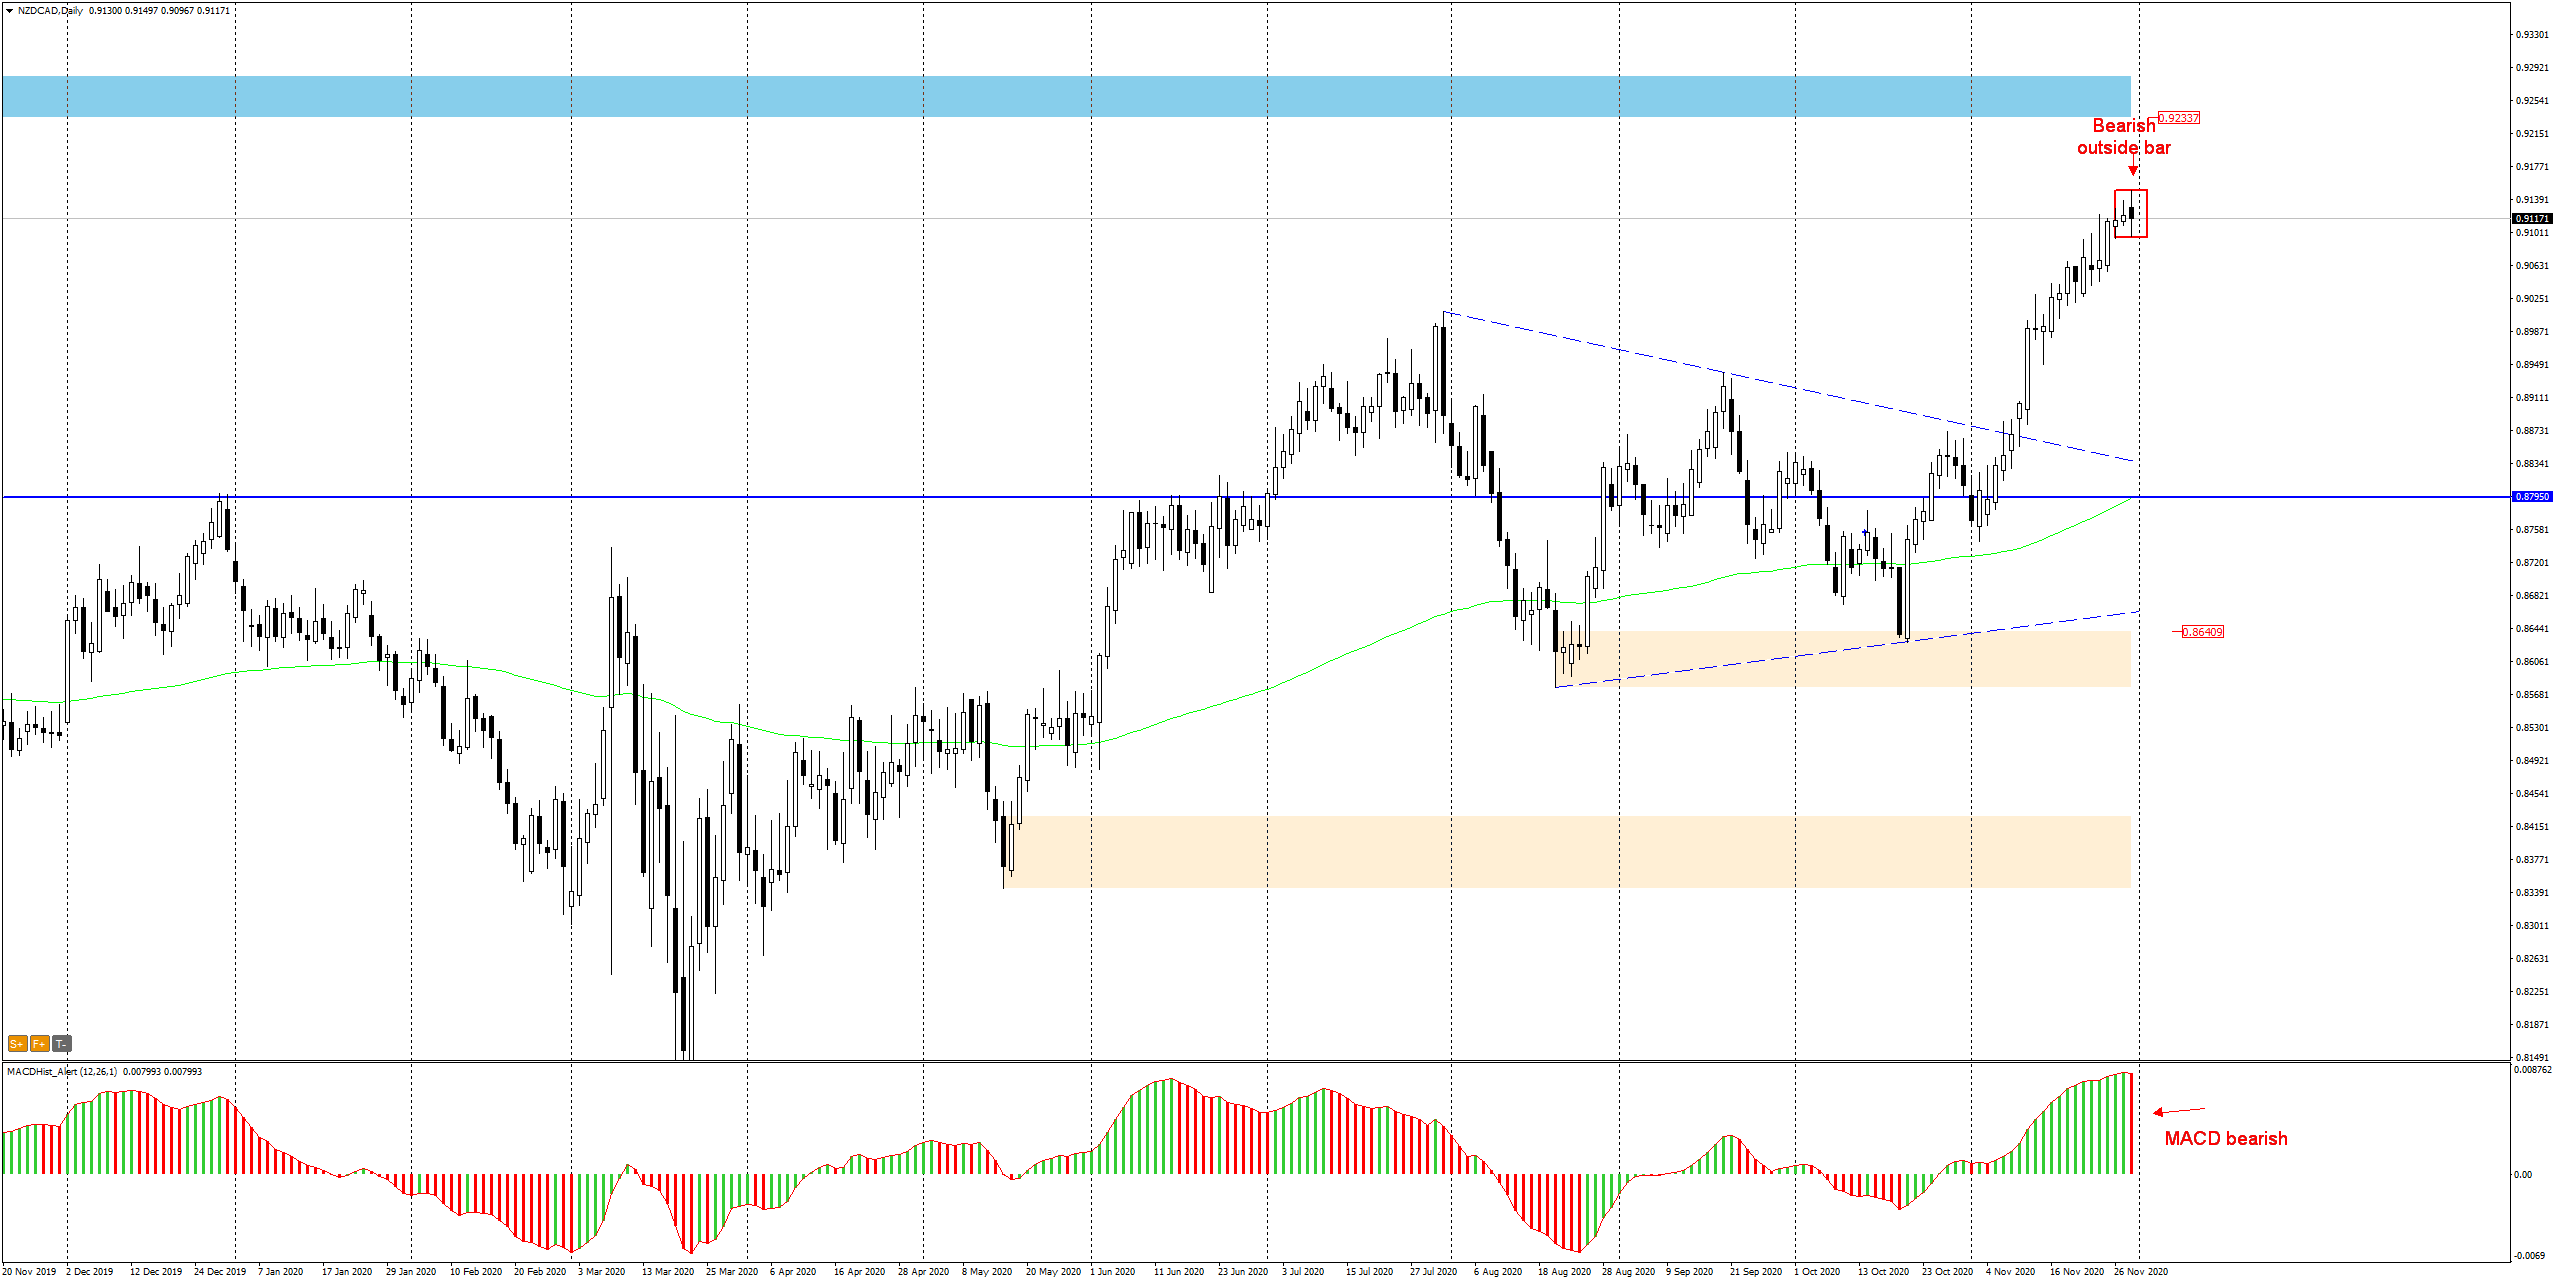
Today’s daily candle, which is the last one in November, is bearish and it is forming a bearish outside bar pattern. Breaking down from this formation would be at the same time overcoming the support of the channel from the H1 chart. The maximum appeared on the MACD and the oscillator has entered the downward phase.
Will there be an attack on the channel support?
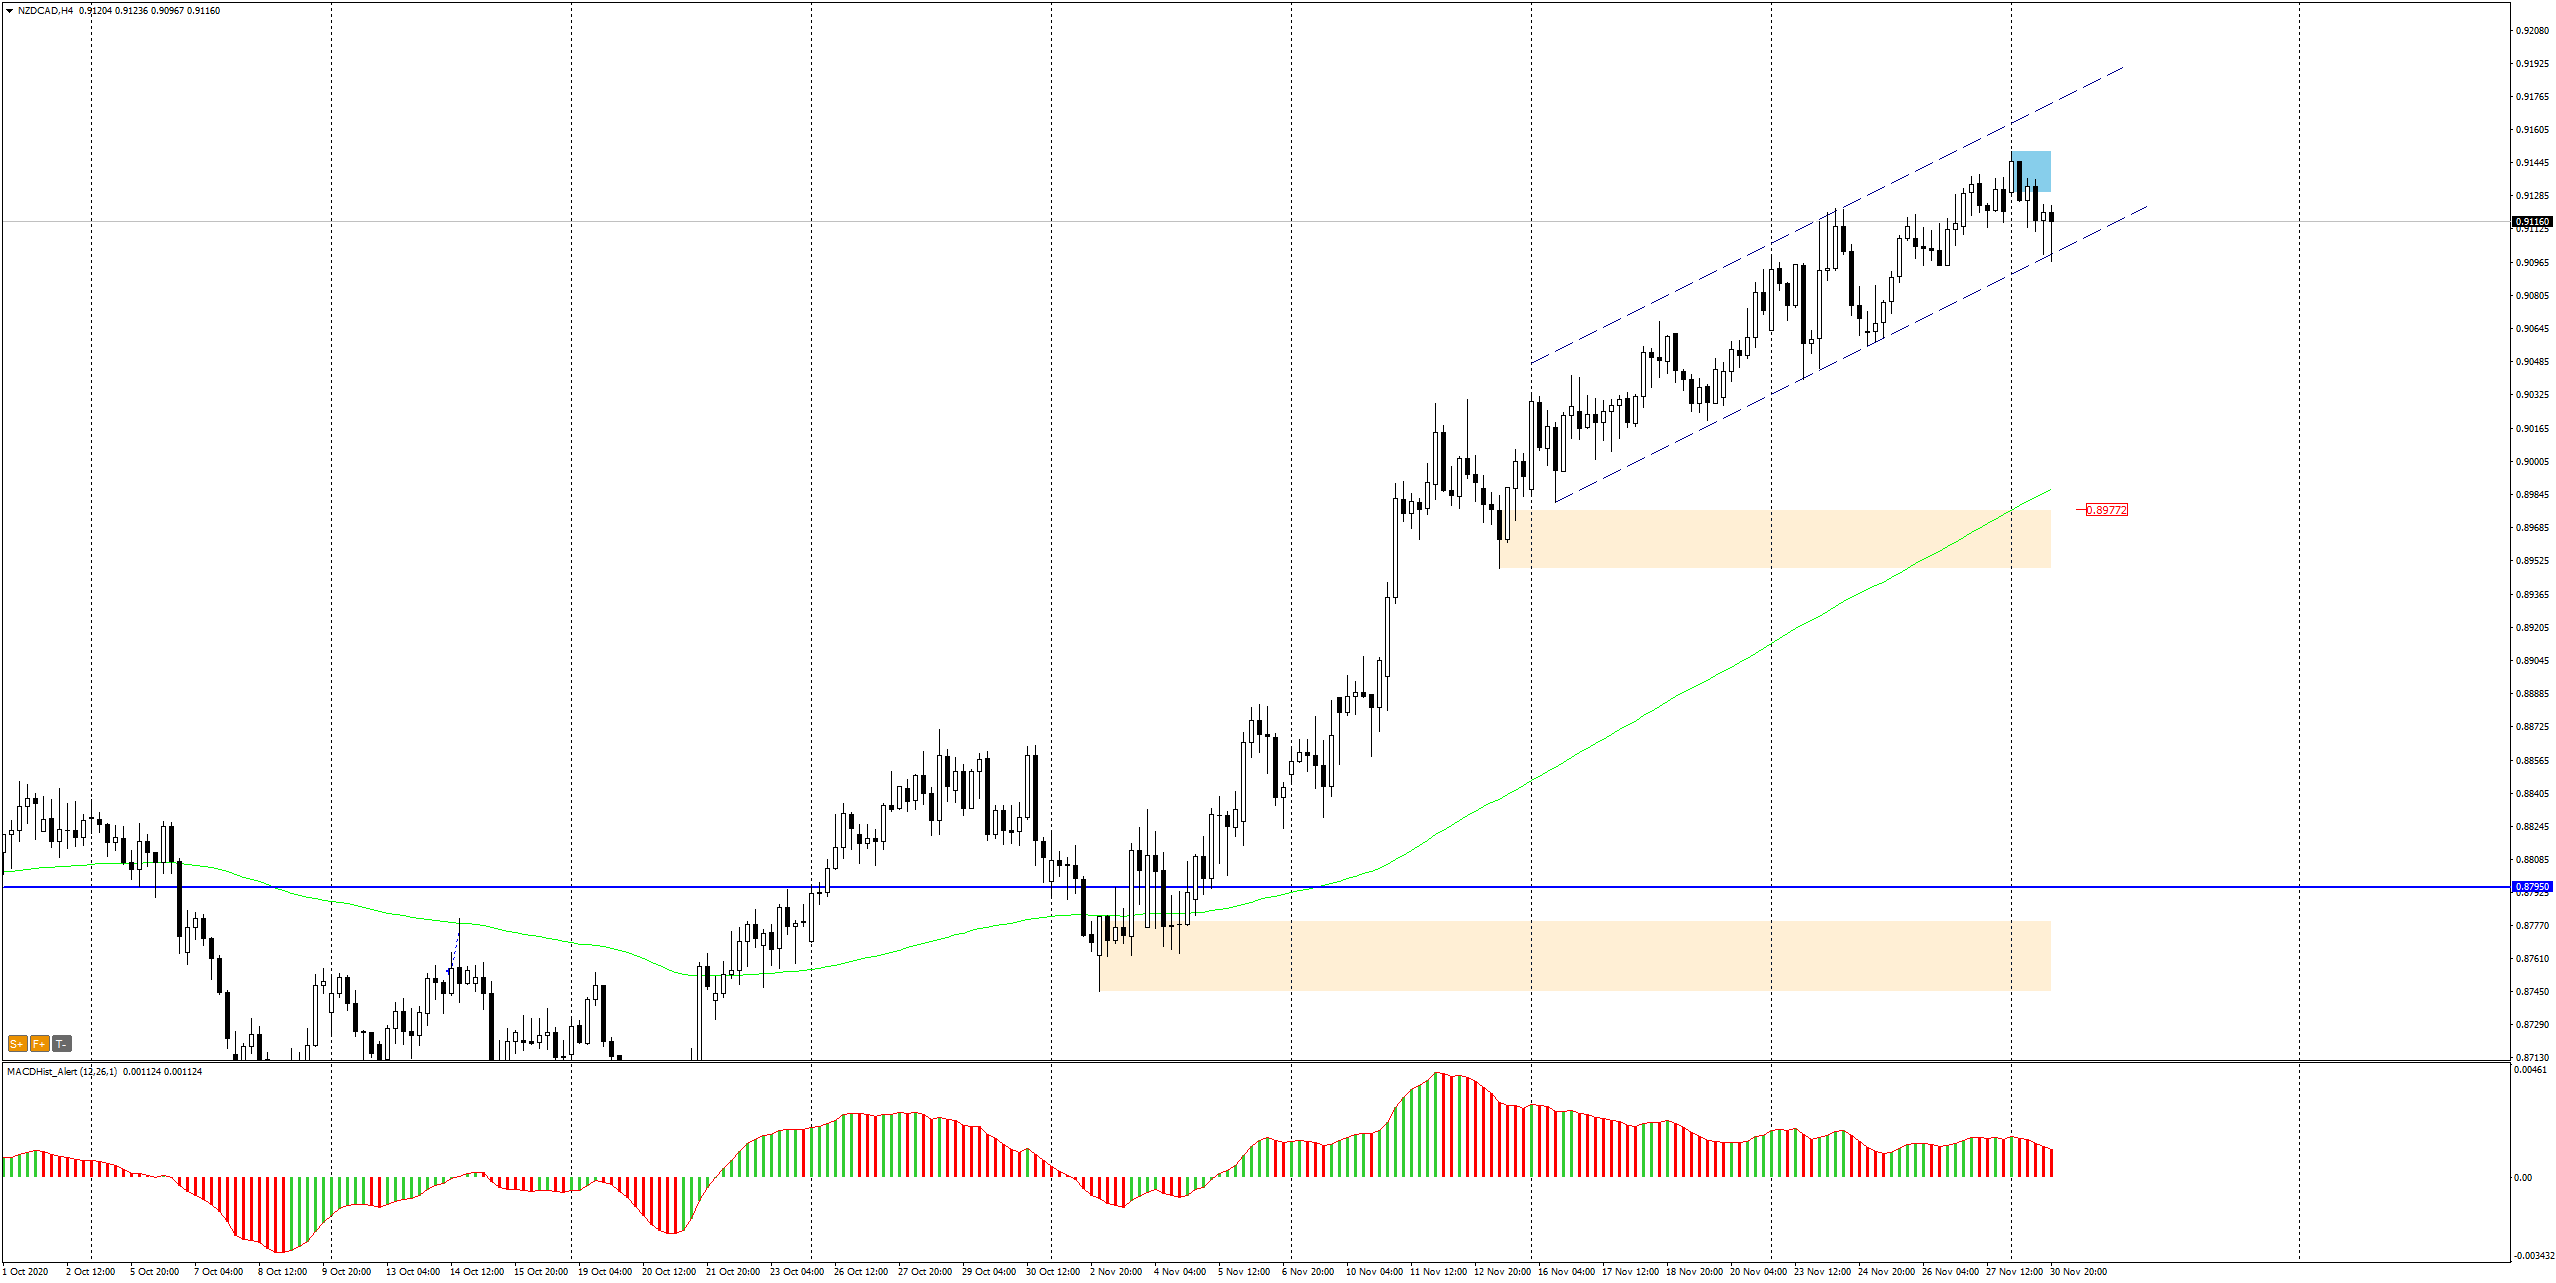
In chart H1 we can see that the price has been moving in an upward direction since the middle of the passing month.
Following the situation on the daily chart, which indicates a high probability of beginning a correction of recent increases, the signal confirming this scenario may be an effective break-out from the channel.
Overcoming the support of the channel, which will be accompanied by a downward divergence, will be a strong signal to open a sell with the nearest target around 0.9050.
I also recommend this stuff:
Trading with PA+MACD, or how to increase the probability of winning
ongoing analysis https://t.me/TradewithDargo
 In our Facebook group, which you can join anytime: https://www.facebook.com/groups/328412937935363/ you will find 5 simple strategies on which my trading is based. There, every day we post fresh analyses of currency pairs and commodities. You can also visit my channel where I post my trading ideas: https://t.me/TradewithDargo


 Review")


