The S&P500 index reached 3160p on 2nd of December – it was ATH. On the same day, there were quite sharp falls, which were aggravated during the Tuesday session.
Wednesday’s quotations were within the range of the previous day and the Inside Bar pattern appeared on the daily chart.

XM offers traders minimum deposits from $5 and security through CySEC, ASIC and FCA licenses. Trade with a broker with 10 years of market tradition and more than 2.5 million clients worldwide
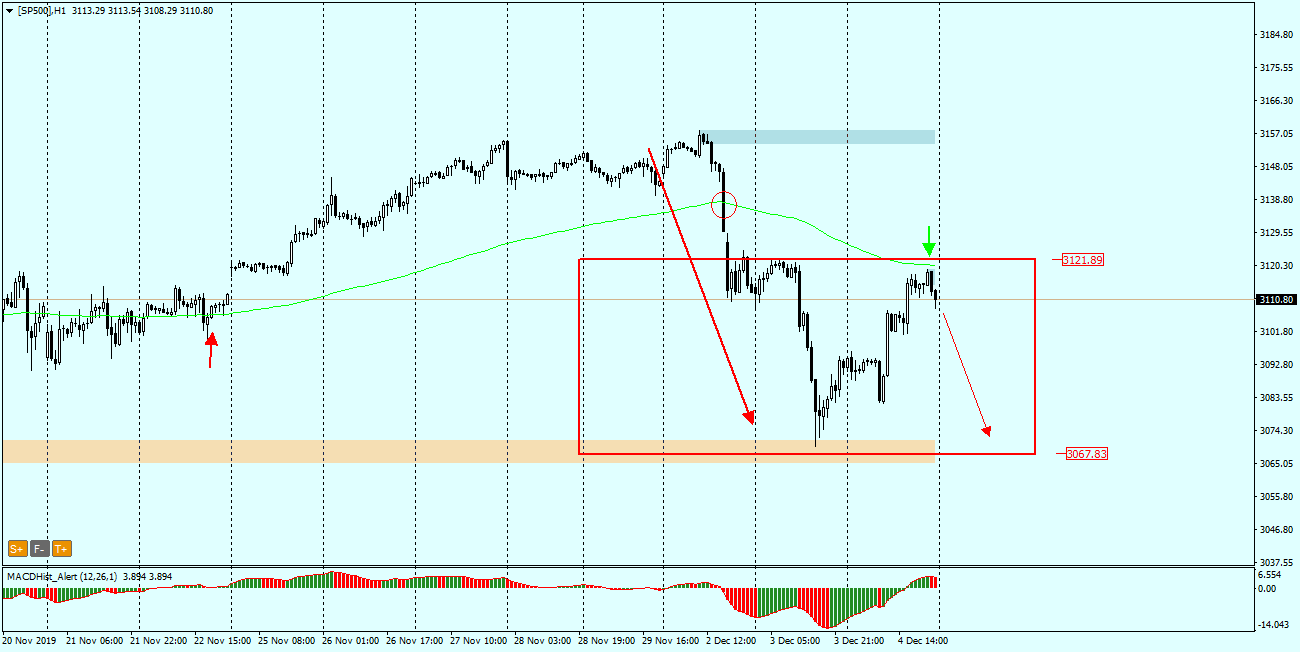
When we look at chart H1 in terms of EMA144 strategy, we can see that S&P500 index after a fairly rapid breaking the EMA144 on 4 December turned back and tested the average from below, which is now a dynamic resistance. In addition, at this level is the upper limit of the Inside Bar from the daily chart. The MACD has created a maximum and is decreasing which suggests further decreases of the index.
From Monday to Friday – Live trading at 13:00 (London time) chat, analyse and trade with me: https://www.xm.com/live-player/basic
In our Facebook group, which you can join anytime: https://www.facebook.com/groups/328412937935363/ you will find 5 simple strategies on which my trading is based. There, every day we post fresh analyses of currency pairs and commodities


 Review")


