GOLD – a precious metal, known to mankind since when the Egyptians in 3600 BC possessed the ability to smelter this precious metal. Why does Gold mankind desire so much? First of all, gold is a very rare element on earth. All the gold mined so far would fit into a cube with a side of 20 meters and a weight of 172 thousand tons. A solid of such dimensions could contain all the jewellery and bouillon gold gathered so far by people. Secondly, gold is an extremely ductile and perfectly conductive metal, used in electronic devices due to its special property of not reacting with air, moisture and other corrosive oxidants. Thirdly… see point one…;). However, it was not these features of gold that made me analyze the price of Gold. Interesting Price Action formations that appeared on the chart tempted me to become interested in this instrument.
GOLD 29-31.05.2019
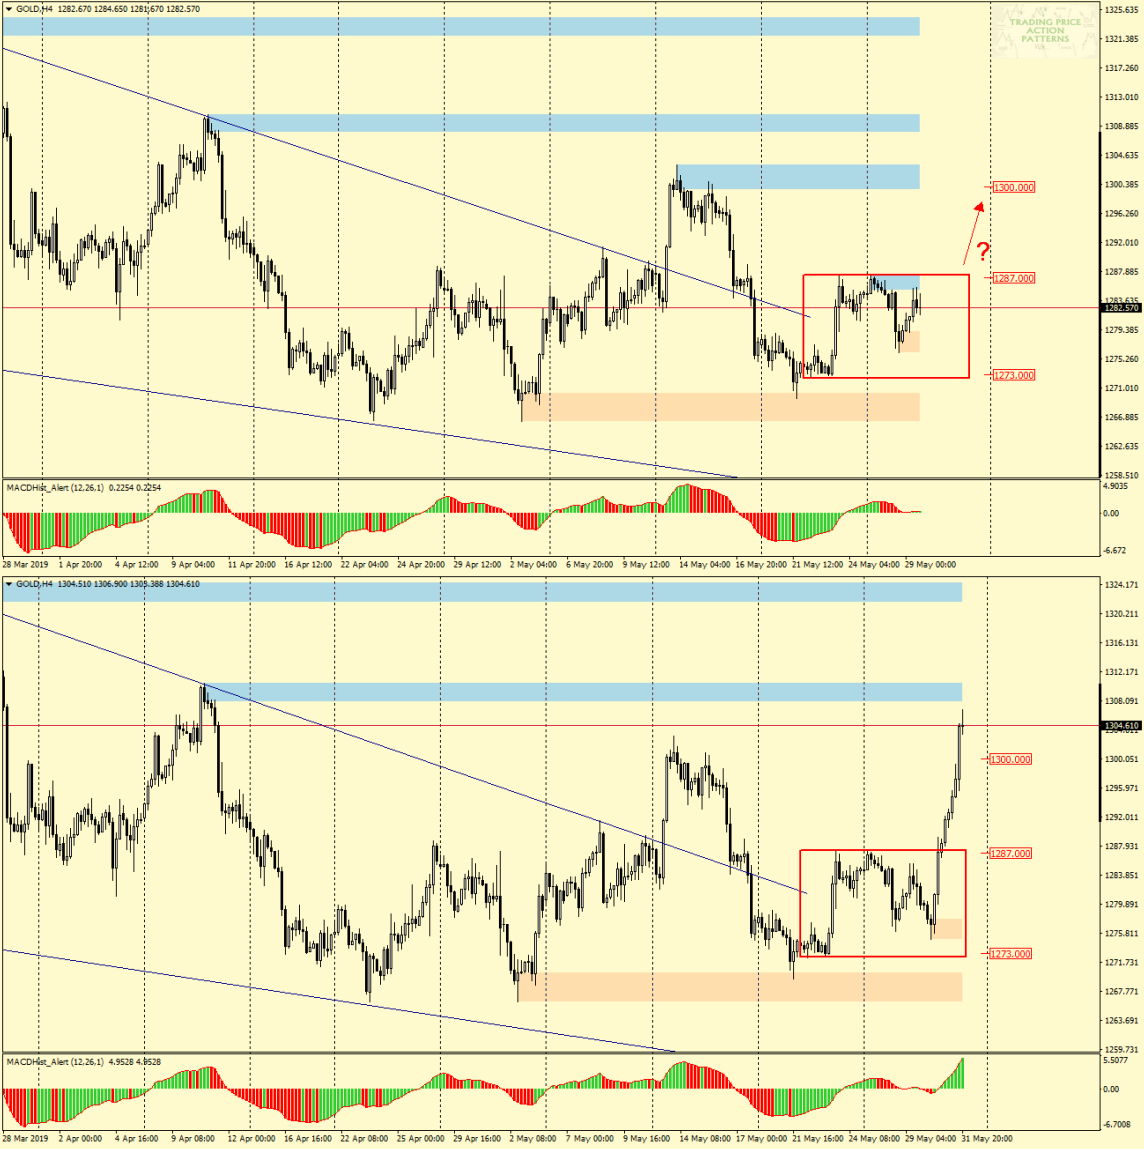
On Wednesday, 29.05, I published a GOLD analysis, which I became interested in when two candlestick formations were formed on the chart – a descending wedge and an Inside Bar. It was difficult to decide on any particular direction, but the upward movement seemed to be more probable from a Price Action perspective, and I wrote so: “-On chart H4 we can see quite clearly that the first breakout from the wedge was not continued and the price went back to formation. A week ago there was a second attempt and so far the price is above the resistance of the wedge, which was successfully tested tonight – resulting in a rebound from that resistance, which has now served as price support.
It seems that the direction of breaking out of the IB will be the decisive factor in the future direction of the price of Gold. So far, everything indicates that it will go up.”
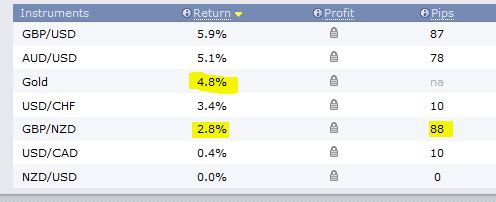
The situation shown in the attached graph confirms that the theory is consistent with practice, the direction proved to be well predicted, while the range of the move turned out to be more impressive than expected. Once again, the wedge and Inside Bar formations proved their worth and the market behaved in accordance with the theory, i.e. the principles of Price Action.
GBPCHF 28-31.05.2019
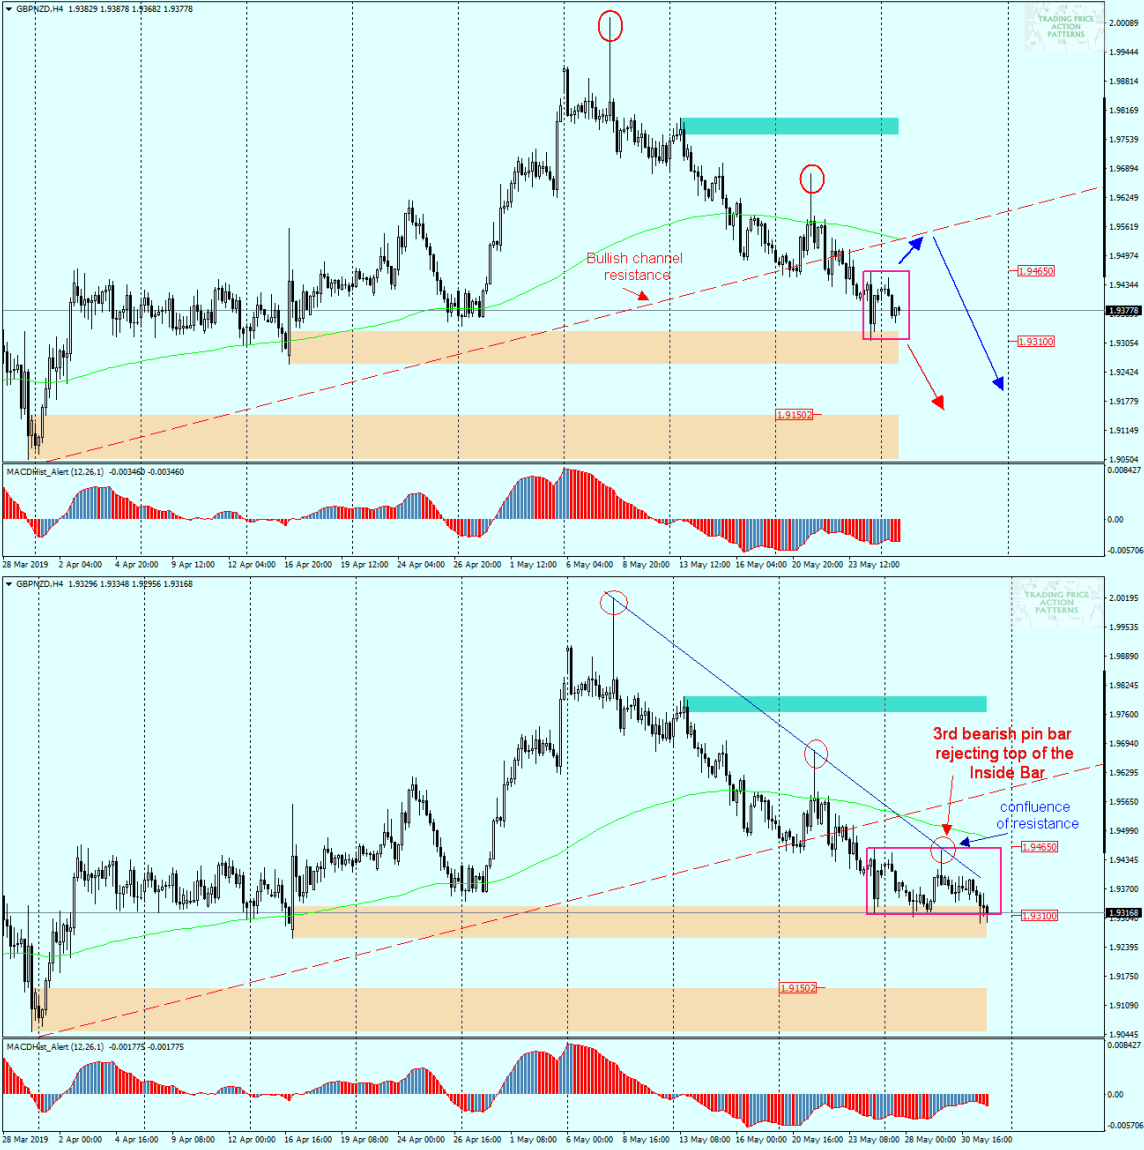
I became interested in this pair not only because of its high volatility in comparison to other forex instruments but also because of the formation of Inside Bar. I assumed two possible scenarios depending on the direction of the breakout, but in the end, both scenarios were to direct the quotes to the south.
In Monday’s GBPCHF analysis I wrote: “If you look at chart H4 below, you can consider two scenarios, depending on the direction in which the quotes are breaking out of the aforementioned IB formation.
On the chart, I marked the upward scenario – “blue” and downward scenario – “red”. Bearing in mind that during the recent declines there were two distinct pin bars indicating a clear reluctance of the market to grow, the IB analysed will probably turn out to be a continuation of the declines, therefore the “red” scenario seems more likely.“
As can be seen from the attached picture, none of the scenarios has materialised and the price is still moving in IB. What is worth noting, however, is another attempt to beat the top shelf of the IB, finished with the creation of a pin bar, the third one this month. They form a local downward trend line (blue line) and at the intersection, with Inside Bar high a confluence of resistances was created.
A similar situation (confluence of resistance) occurred today on USDCAD… and I leave it to the readers of this article to check how it influenced the quotations. I will devote the next analysis to this pair, which will appear at the beginning of next week. And this one, based on the above analyses, I ended up like this:

 In our Facebook group, which you can join anytime: https://www.facebook.com/groups/328412937935363/ you will find 5 simple strategies on which my trading is based. There, every day we post fresh analyses of currency pairs and commodities


