 Trading Inside Bars –under this heading you will find analysis made on basis of one of the most known Price Action formation – Inside Bar. Statistics show that best results gives breakout from Inside Bar formation on Daily chart, so mainly this time frame charts will be analysed.
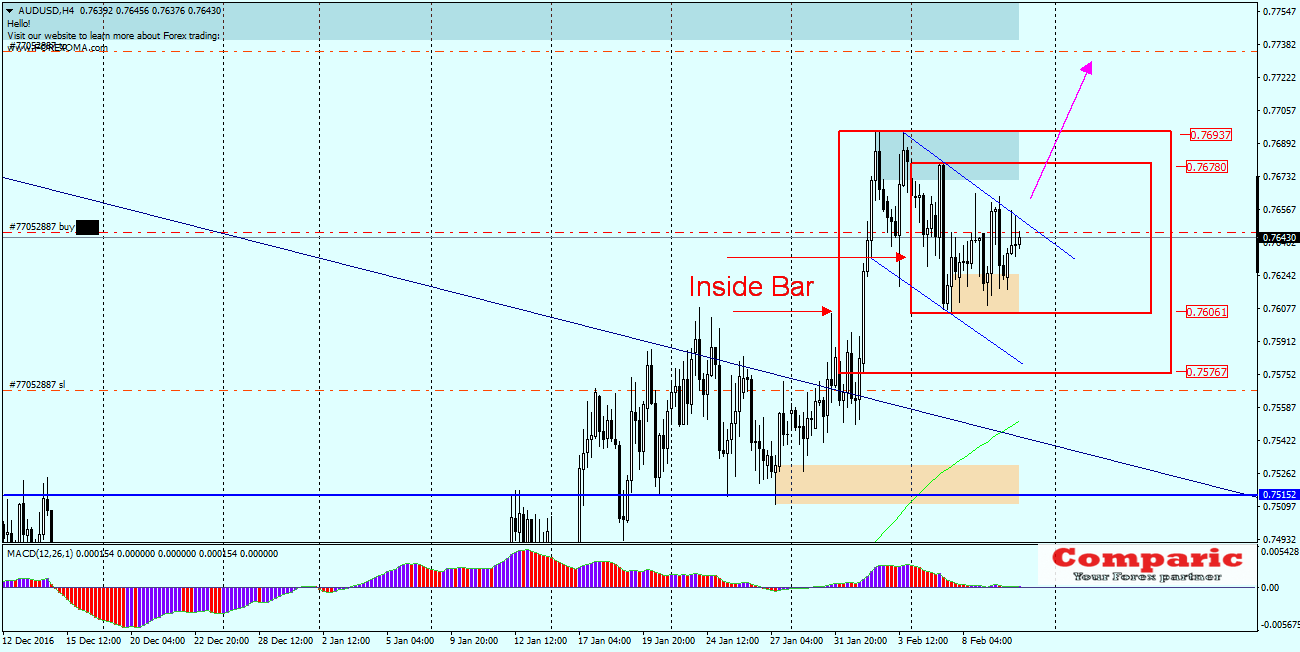
AUDUSD (continued)
I’m coming back to the pair AUDUSD and described on Monday Inside Bar. Throughout the week the price circulates in the upper half of the IB, the green line from the previous chart proved to be so far undefeated. Moreover, another IB was created in the interior of the former. To make it more interesting price draws a bullish flag formation, which is likely to be broken thru the top. I went Long, plan maximum is the level of 0.7535, but along the way there are local resistances (marked by price in red) which can complicate reaching the target. Breaking the lower range of IB at 0.7575 will make this setup invalid.


 Review")


