On Mondays, while analyzing the charts, you can broaden the range of intervals by a weekly period.
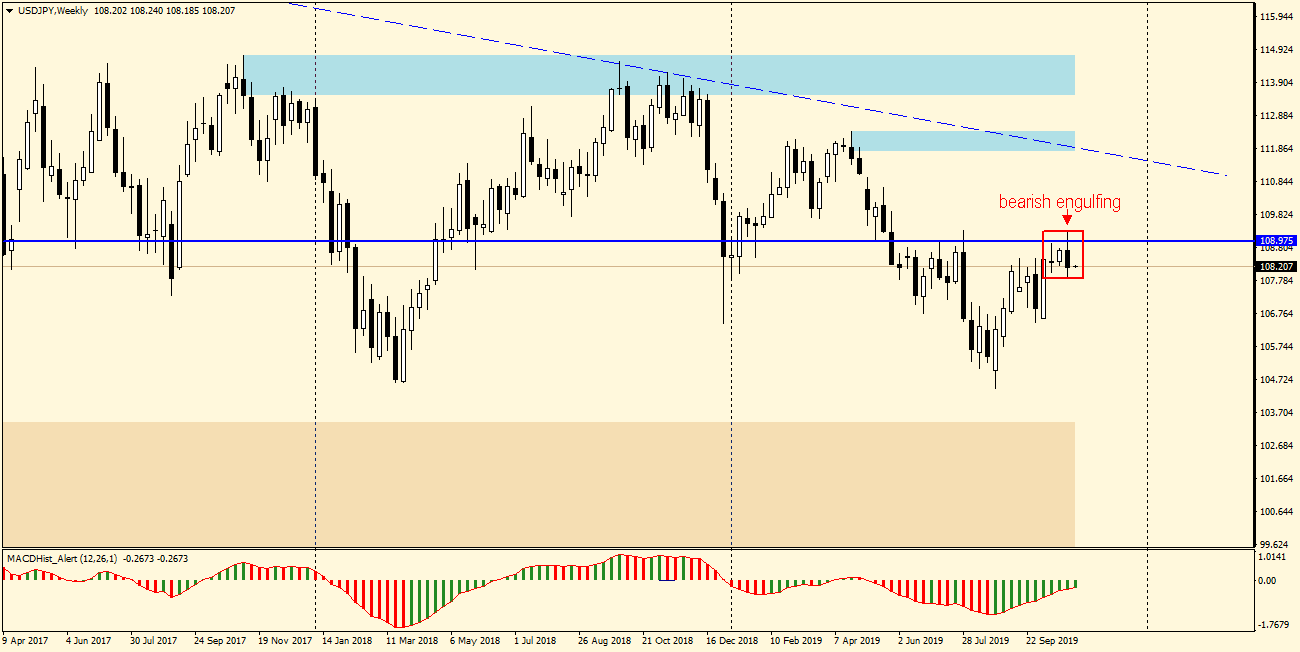
The mother candle of the pattern has a maximum above the round level of 109.00, where the neck line of the H&S pattern also runs, but the week’s close is below this important level (the candle has a long upper wick) which suggests rejection.
XM offers traders minimum deposits from $5 and security through CySEC, ASIC and FCA licenses. Trade with a broker with 10 years of market tradition and more than 2.5 million clients worldwide
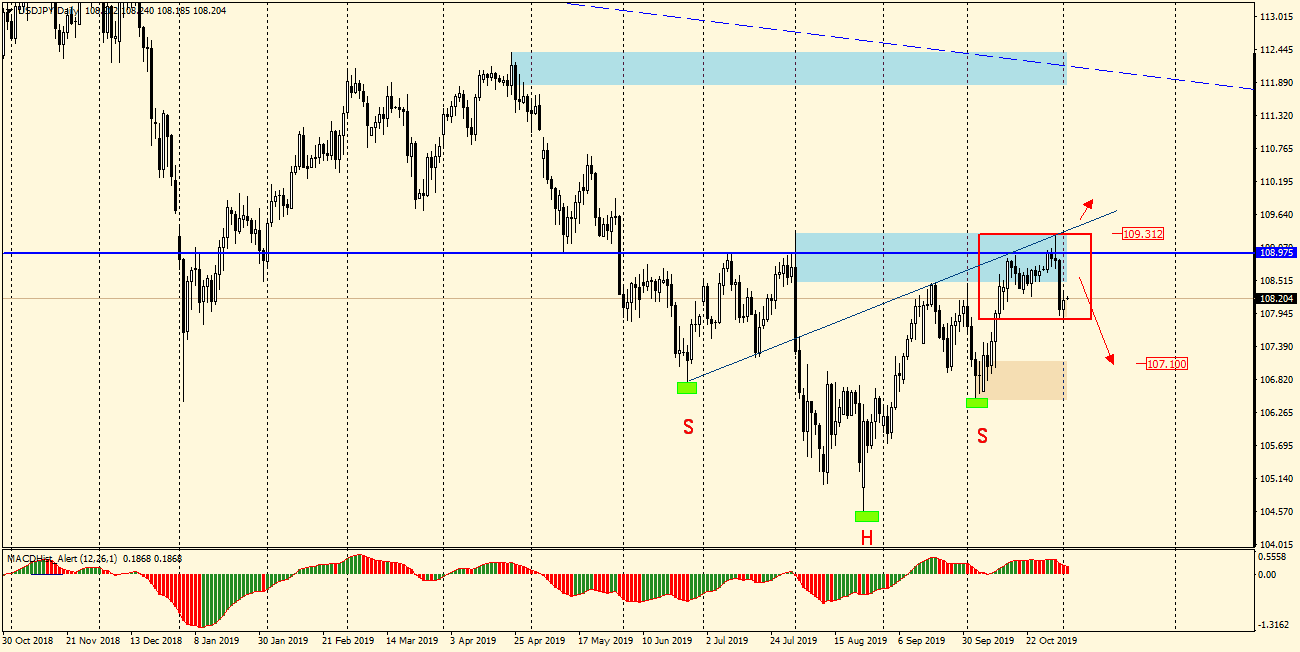
If you look at the daily chart, you can draw a diagonal local support/resistance line from which the price has already been rejected three times.
The MACD oscillator is in a downward divergence process, which leads me to focus on shortening the pair. A level which can be interesting to watch is 108.75 where we have a S/R level, there I would wait for a sign of weakness and go short.
In our Facebook group, which you can join anytime: https://www.facebook.com/groups/328412937935363/ you will find 5 simple strategies on which my trading is based. There, every day we post fresh analyses of currency pairs and commodities


 Review")


