With the beginning of September, we began a new series of analyzes in which we test and check the effectiveness of various strategies for Binary Options. We have already checked this strategies so far:
- End of the day, whose summary is available here
- EMA Rainbow, which you will find here
- EMA 8/20, a detailed summary of which is available here
- ADX EMA, whose detailed summary is available here
- ADX EMA II, which is here
- Awesome SMA, the summary of which is available here
- MA AO Stochastic, the summary of which can be found here
As promised, today is the time to present another strategy, which will be tested for the next two weeks.
Over the past two weeks, I tested MA AO Stochastic’s strategy on the pages of Comparic.com. All signals generated by this strategy and daily summaries of their effectiveness could be followed under the tag “MA AO Stochastic”. Detailed statistics of this strategy are available in a separate article.
During the tests, I noticed that many of the potentially profitable signals did not meet the basic assumptions of the strategy. Exactly the fact that one of the elements conditioning the signal was that the Awesome Oscillator moves around 0. In strong trends, however, we observed this indicator move in large ranges. In connection with the above, I decided to test the strategy that overrides this oscillator in the next two weeks.
What also caught my attention (this time positively) was that because the second candle after crossing the moving average was the signal one (not as usually, the first candle), the amount of false signals was definitely lower .
MA Stochastic
The name MA Stochastic came from two indicators used in the strategy – moving average and a stochastic oscillator. We invite you to familiarize yourself with the full description of the system and its practical application.
Setting of indicators
Moving average – change period to 12, other settings unchanged
Stochastic Oscillator -% K with a value of 12,% D and Slowing with a value of 3.
The graph should look like this at the moment (the colours may vary depending on the settings chosen by the user):

System rules
- Interval on the graph – M5
- Option expiration time – 15 minutes (we are interested in 3 candles)
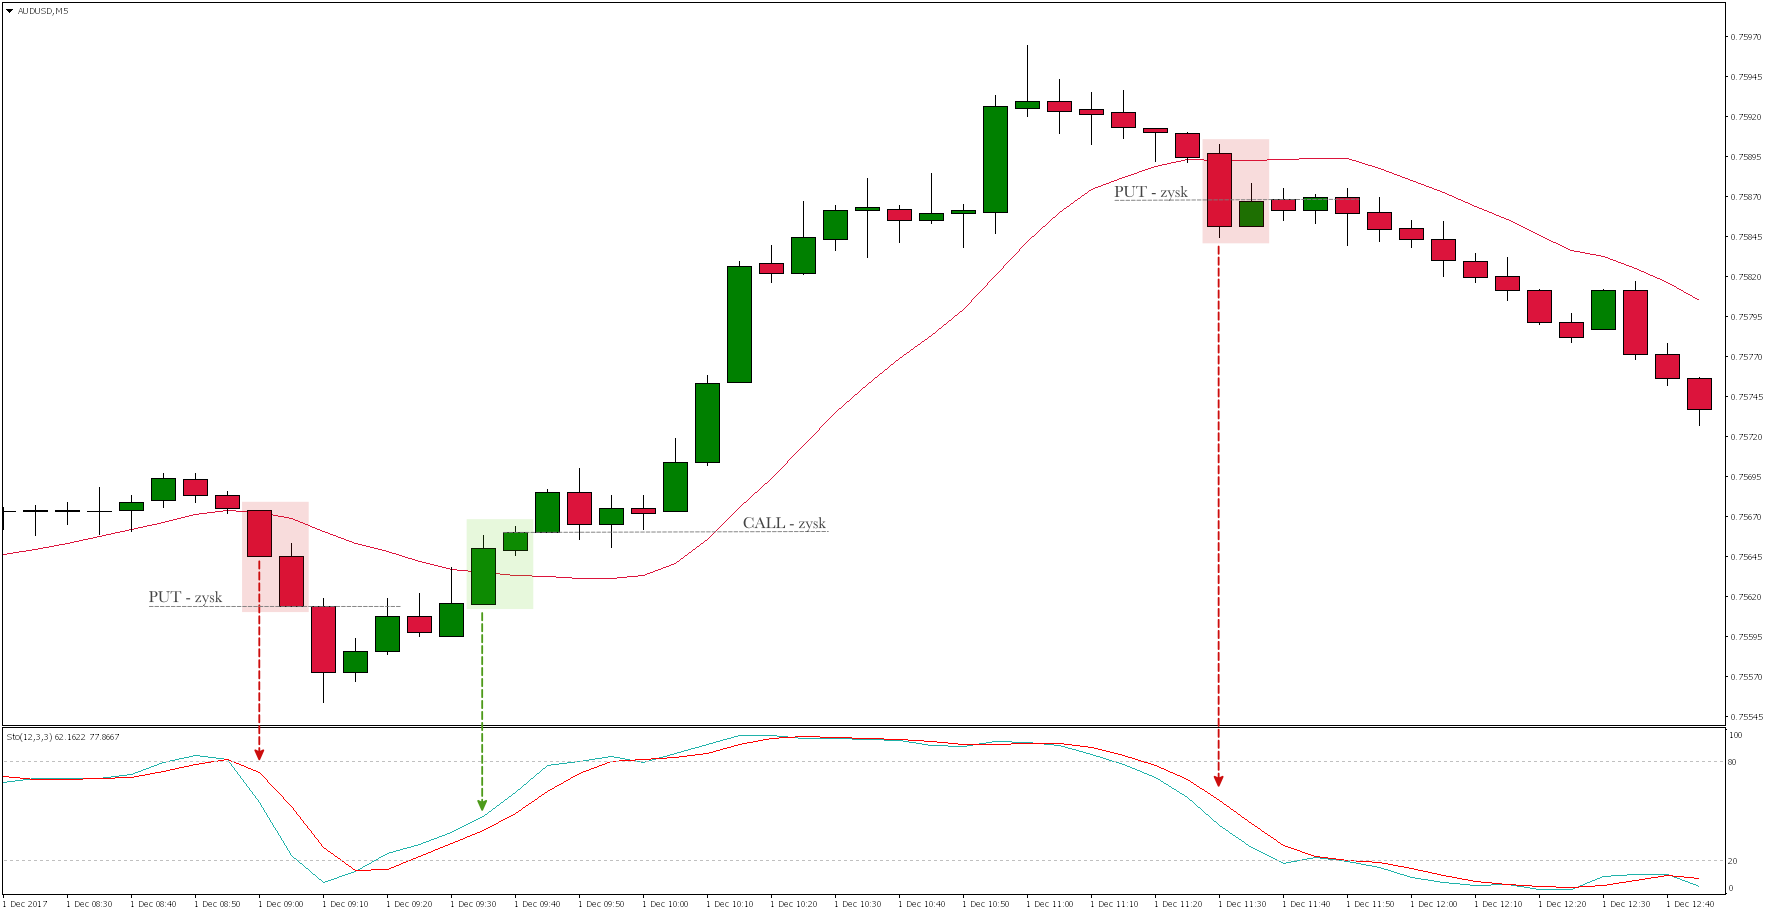
Playing the PUT option
- MA must go through the candle’s body and be above the next candle
- Stochastic goes down (the higher the indicator the better)
- When both signals overlap, play the PUT option with expiry time – 3 consecutive candles (for the M5 chart, it will be 15 minutes)
Playing the CALL option
- MA must go through the body of the candle and be under the next candle
- Stochastic goes up (the lower the indicator the better)
- When both signals overlap, play the CALL option with expiry time of 3
- consecutive candles (for the M5 chart, it will be 15 minutes options)

Try trading binary options on currencies, indices, commodities and shares of popular companies. If you lose, regardless of the size of the loss, you never lose more than you bet. You can also choose other expiration hours for options, both shorter and longer. Create a real account and earn 50 to 150% Welcome Bonus.


 Review")


