TRADE BTC OPTIONS THANKS TO TOPOPTION
For the technical analysis I will use primarily:
- Trend lines
- Resistance and support levels
- Classic TA basic formations (triangles, wedges, flags)
- Basic Price Action patterns (pin bar, inside bar, outside bar)
- Fibonacci retracement to determine potential support and resistance levels
BTC/USD Monthly and W1
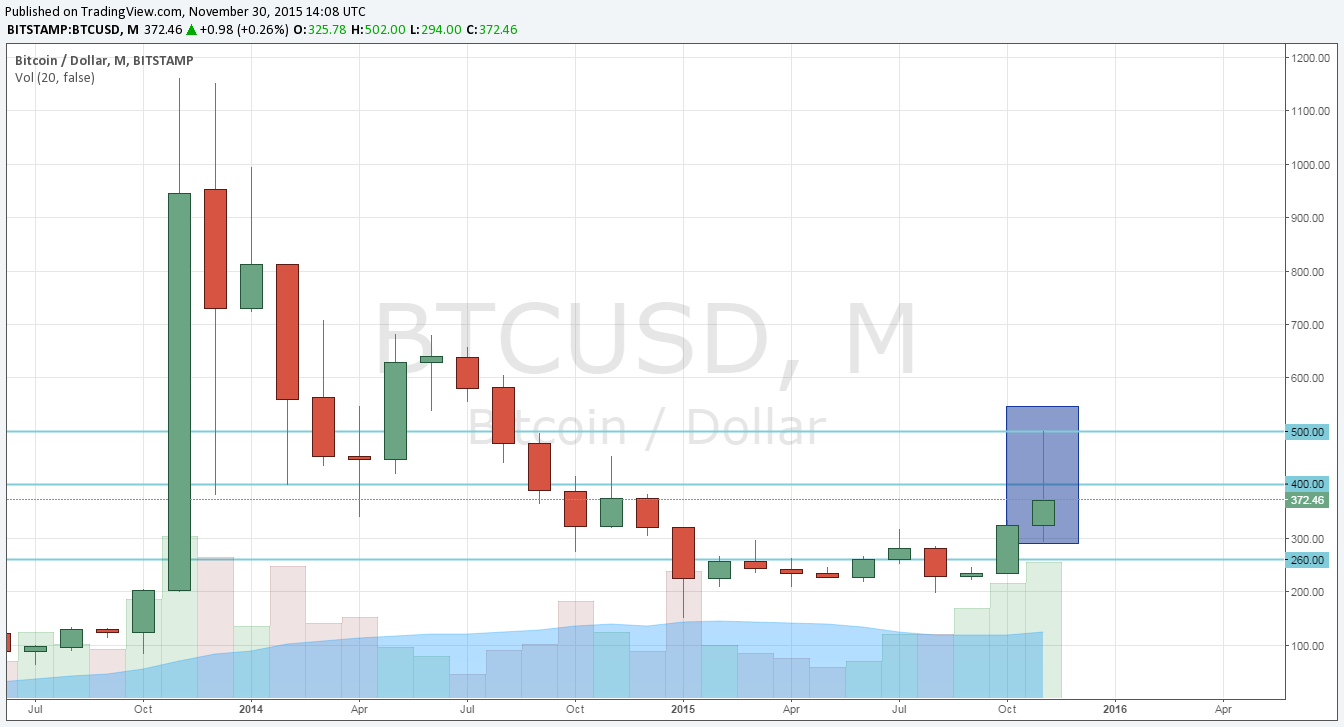
The situation on the monthly chart has not changed much since the last week’s analysis – the price is still kept under round resistance levels of 400.00 and 500.00 (although the candle body broadened a little). Today the last trading day of November and if the price closes in such form, then the market will receive a bearish pin bar.
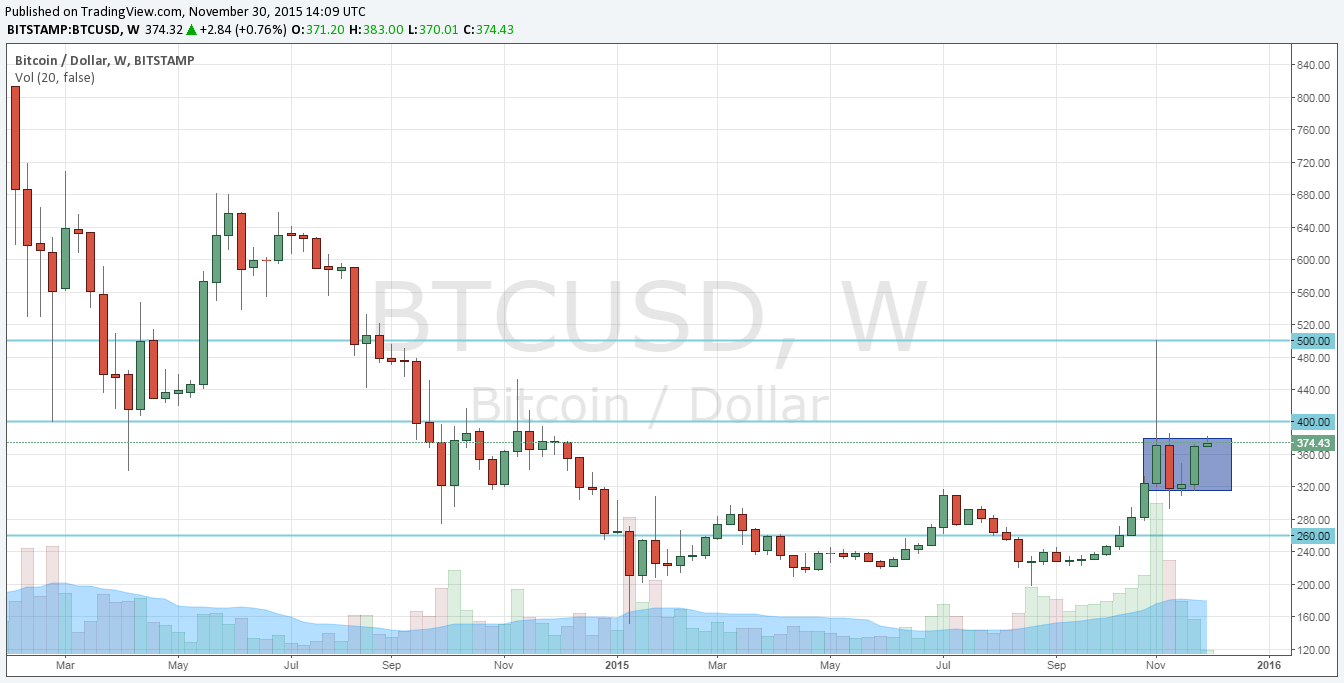
The weekly chart shows however, that trade in November was locked in the consolidation between 317.00-375.00. As long as the price does not leave this figure, it is hard to make any trading decisions.
BTC/USD D1
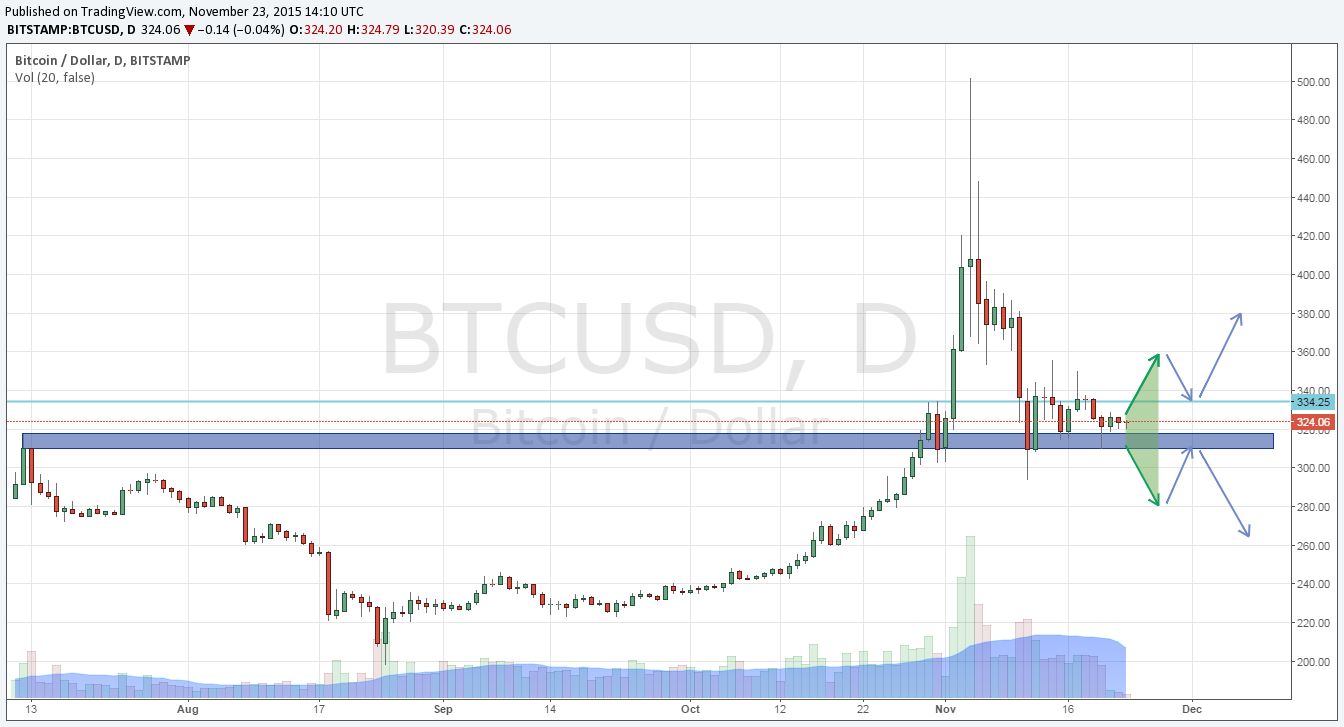
Moving to the daily chart, we see that the price of the second week of November leans o the support all the time (near 315.00-319.00), but finally it managed to rebound. At this point however, we are capped by prior support/resistance at 370.00. If the daily candle closes in such form as it is now, the we will look for sales signal (long upper wick of a candle – false breakout).
BTC/USD H4
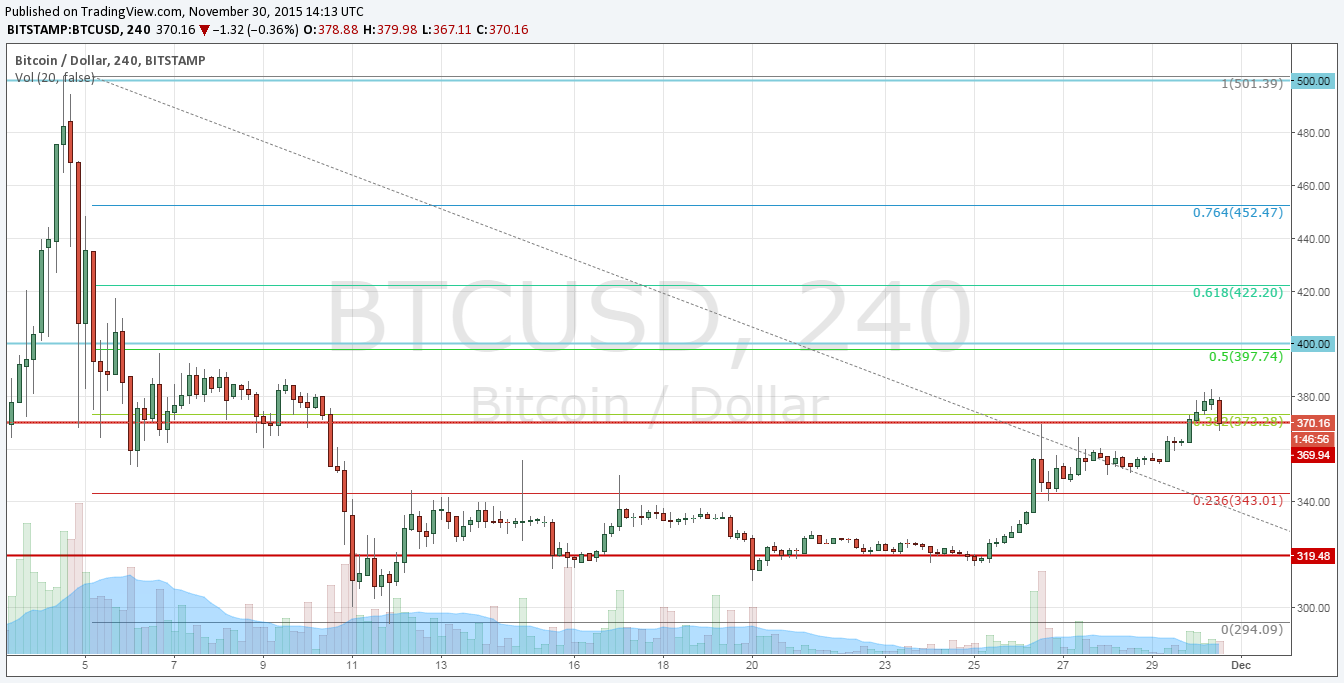
Finally, turning to the intraday chart (H4), it is worth noting that the price for almost a whole month moved between 320.00 and 23,6% Fibonacci retracement (343.00). In the last week the Fibonacci resistance was broken, like another price cap near 370.00 (coinciding with 38.2% Fibo). Currently we observe re-test from the top – if signal shows here, we will use it during next few sessions. Also, it should be noted, that the higher TF (D1) will have stronger importance here.


