TRADE BTC OPTIONS THANKS TO TOPOPTION
For the technical analysis I will use primarily:
- Trend lines
- Resistance and support levels
- Classic TA basic formations (triangles, wedges, flags)
- Basic Price Action patterns (pin bar, inside bar, outside bar)
- Fibonacci retracement to determine potential support and resistance levels
BTC/USD D1
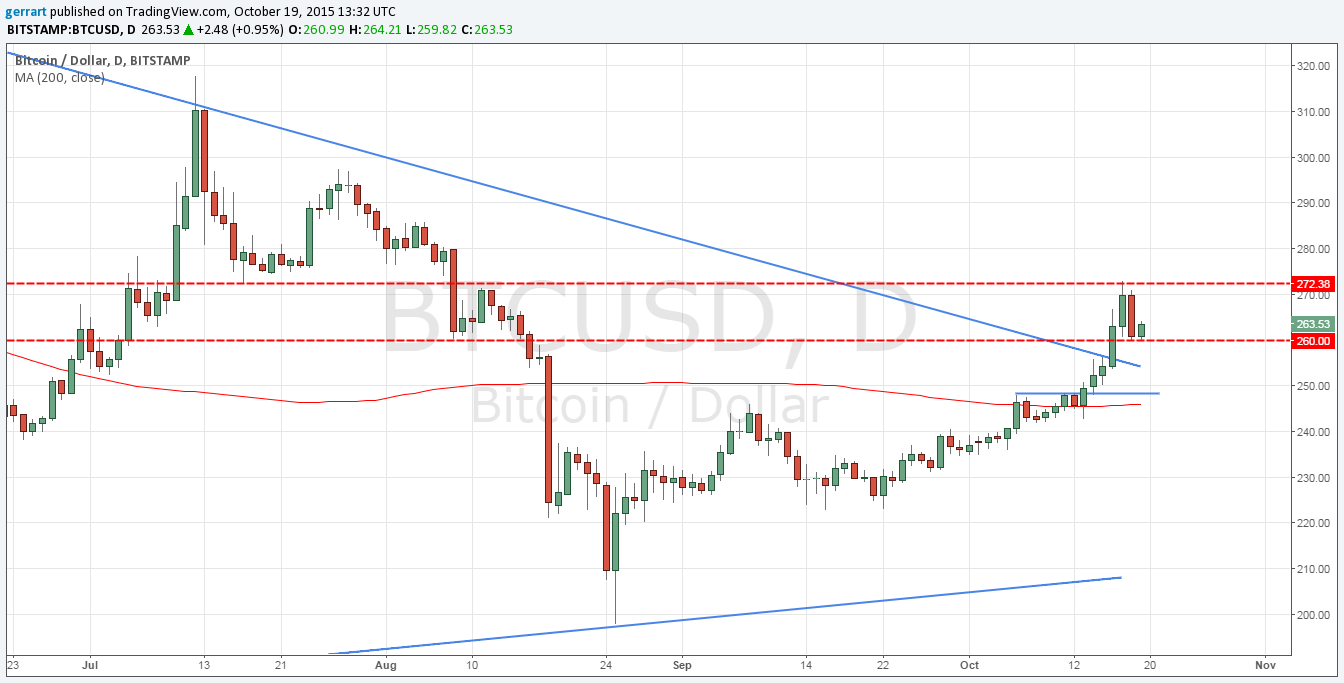
In last week’s analysis, I mentioned the local resistance level just below 250USD – it was eventually defeated and the market demand side was able to „pull out” rate above the mid-term, downtrend line and horizontal resistance 260USD (price is moving sideways above it). Bulls optimism and dynamic growth have been blocked so far below 270-272USD, but breaking above downtrend line gives opportunity to look more positive at the further appreciation.
BTC/USD H4
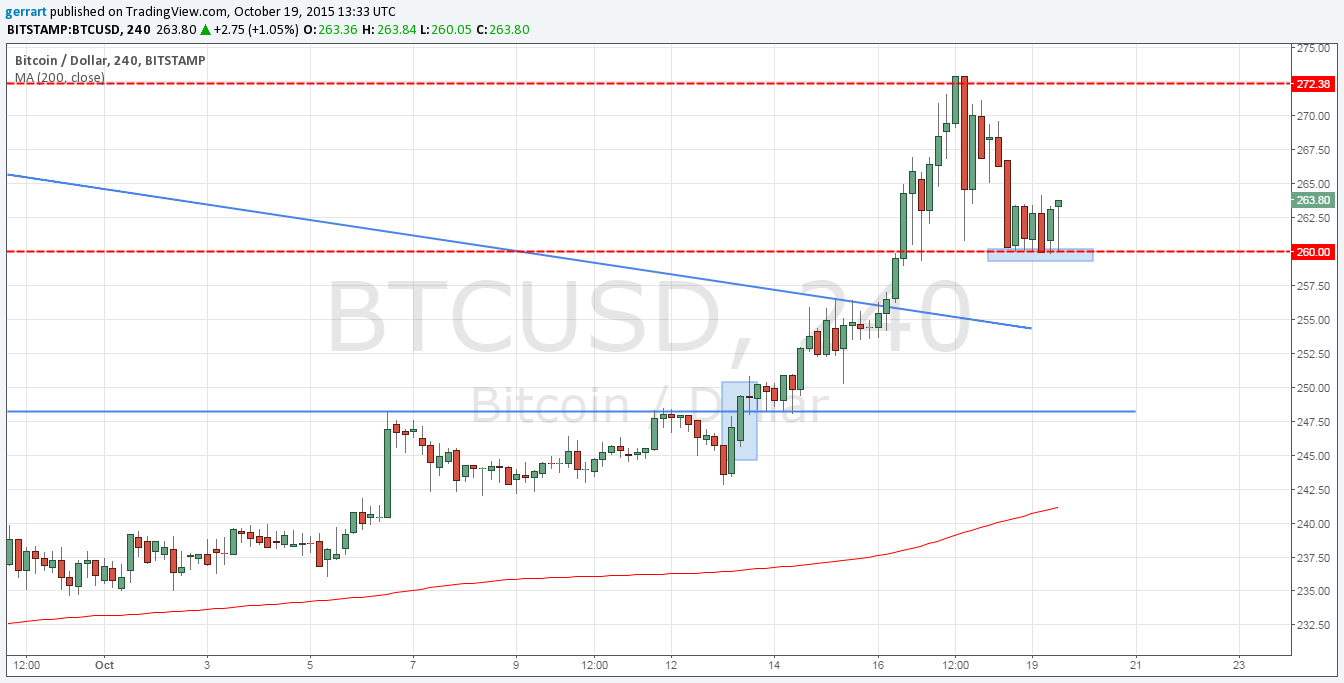
Moving on intraday chart (H4) it is evident, that price after breaking the trend line and resistance 260USD moves so far in 10-dollars-consolidation. Its lower limit is actively tested, but so far refutes the bears attacks.
In a broader perspective (weekly chart), 300USD will be a really important resistance level – and what is more that’s where current rally should aim for.


: Structure and Governance By Specialist Hay Nakash")


