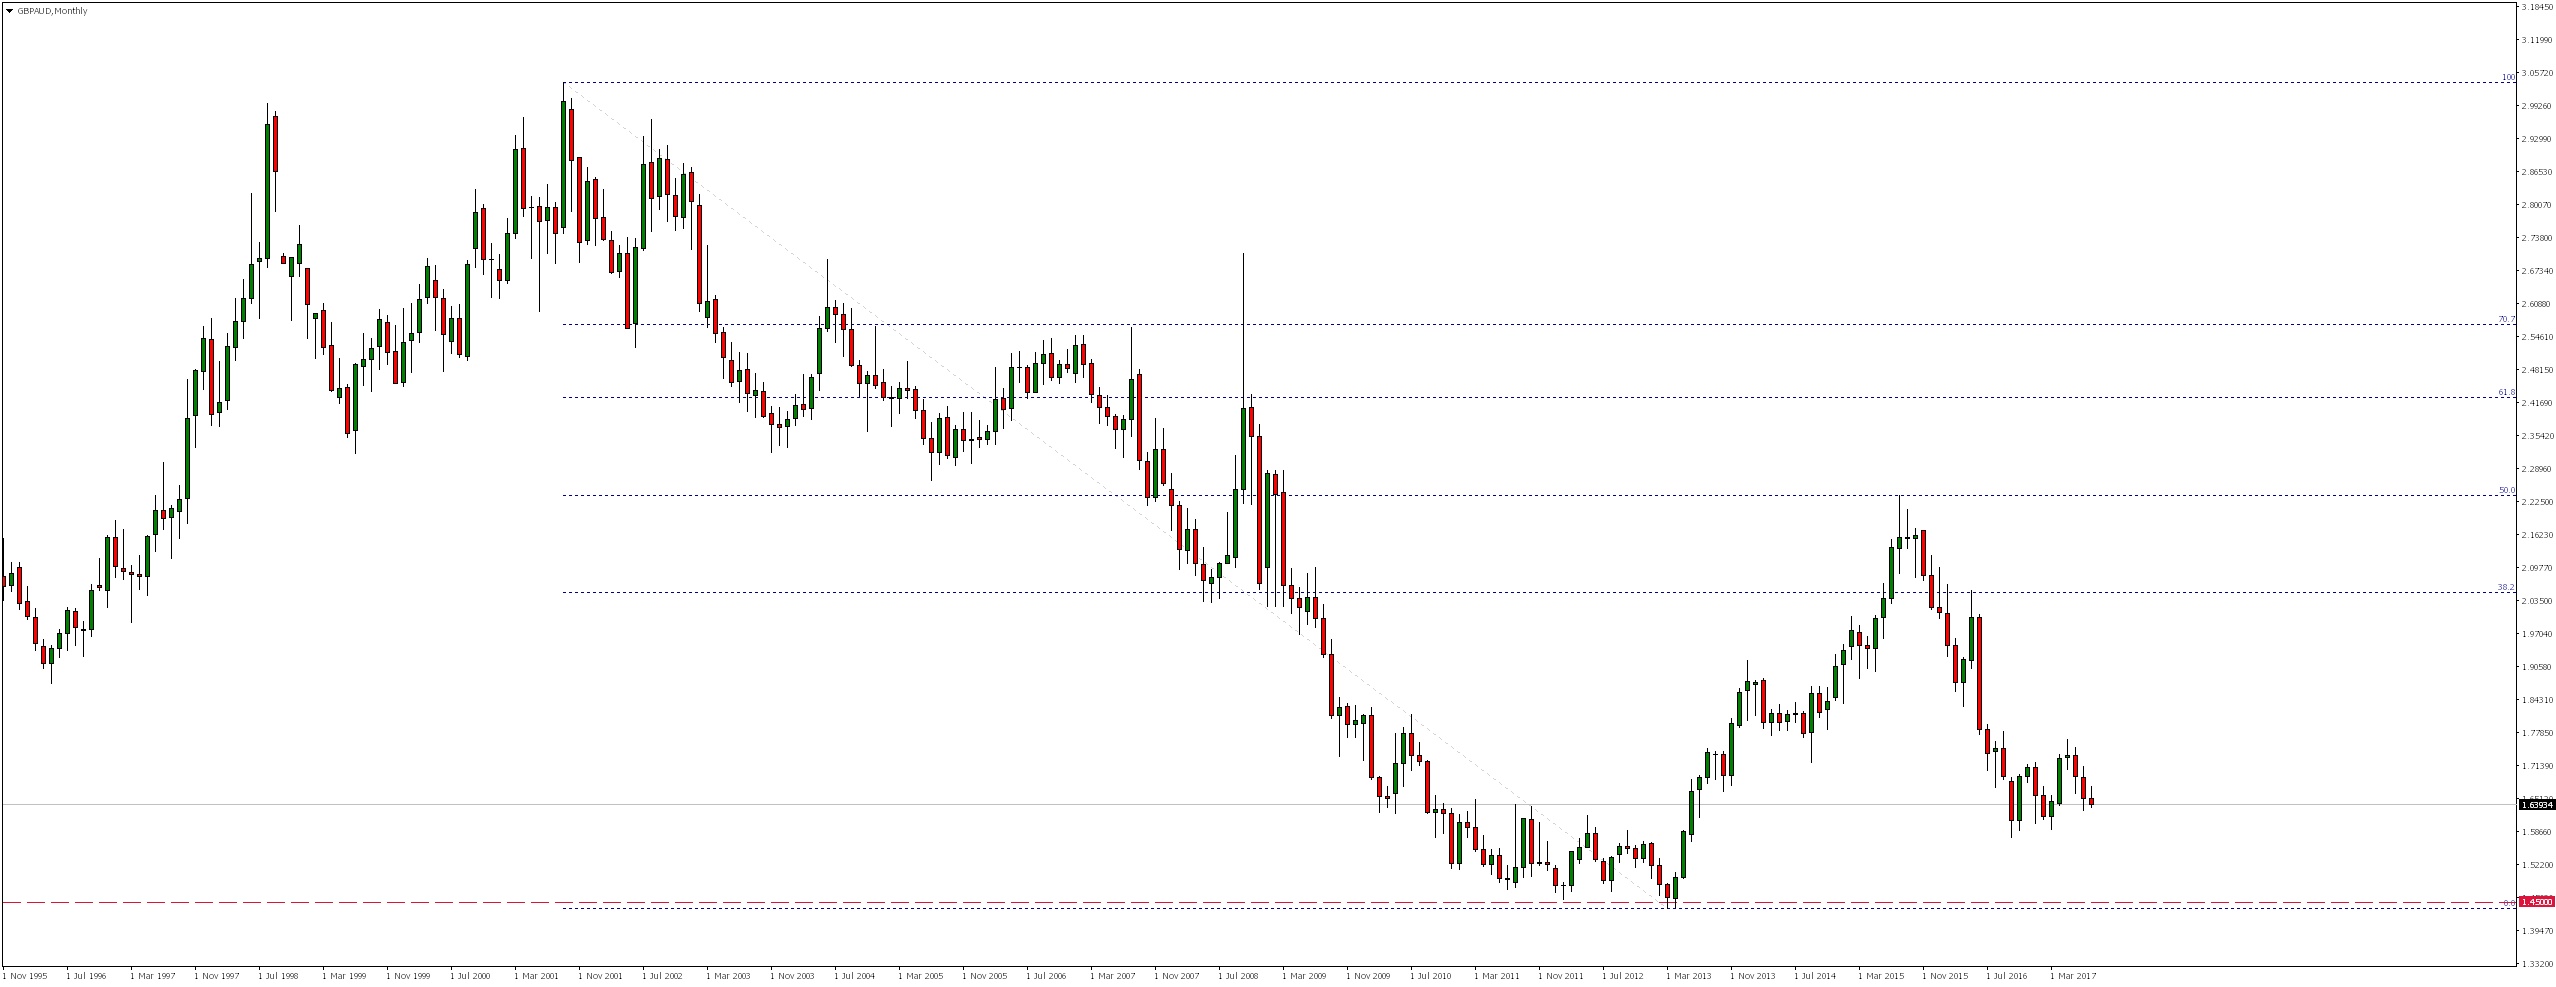
As a result of growth lasting since April 2013, GBPAUD has reached level of 50% of the Fibonacci correction from the previous declines lasting from October 2001. That was the supply reaction, which has led us down to declines seen currently.
Looking at weekly chart, we can see that these drops were reaching local support, where in October last year there was a demand response. Since then market is moving in consolidation, with upper limit coinciding with the 38.2% Fibonacci correction from the previous bearish impulse.
Error, group does not exist! Check your syntax! (ID: 4)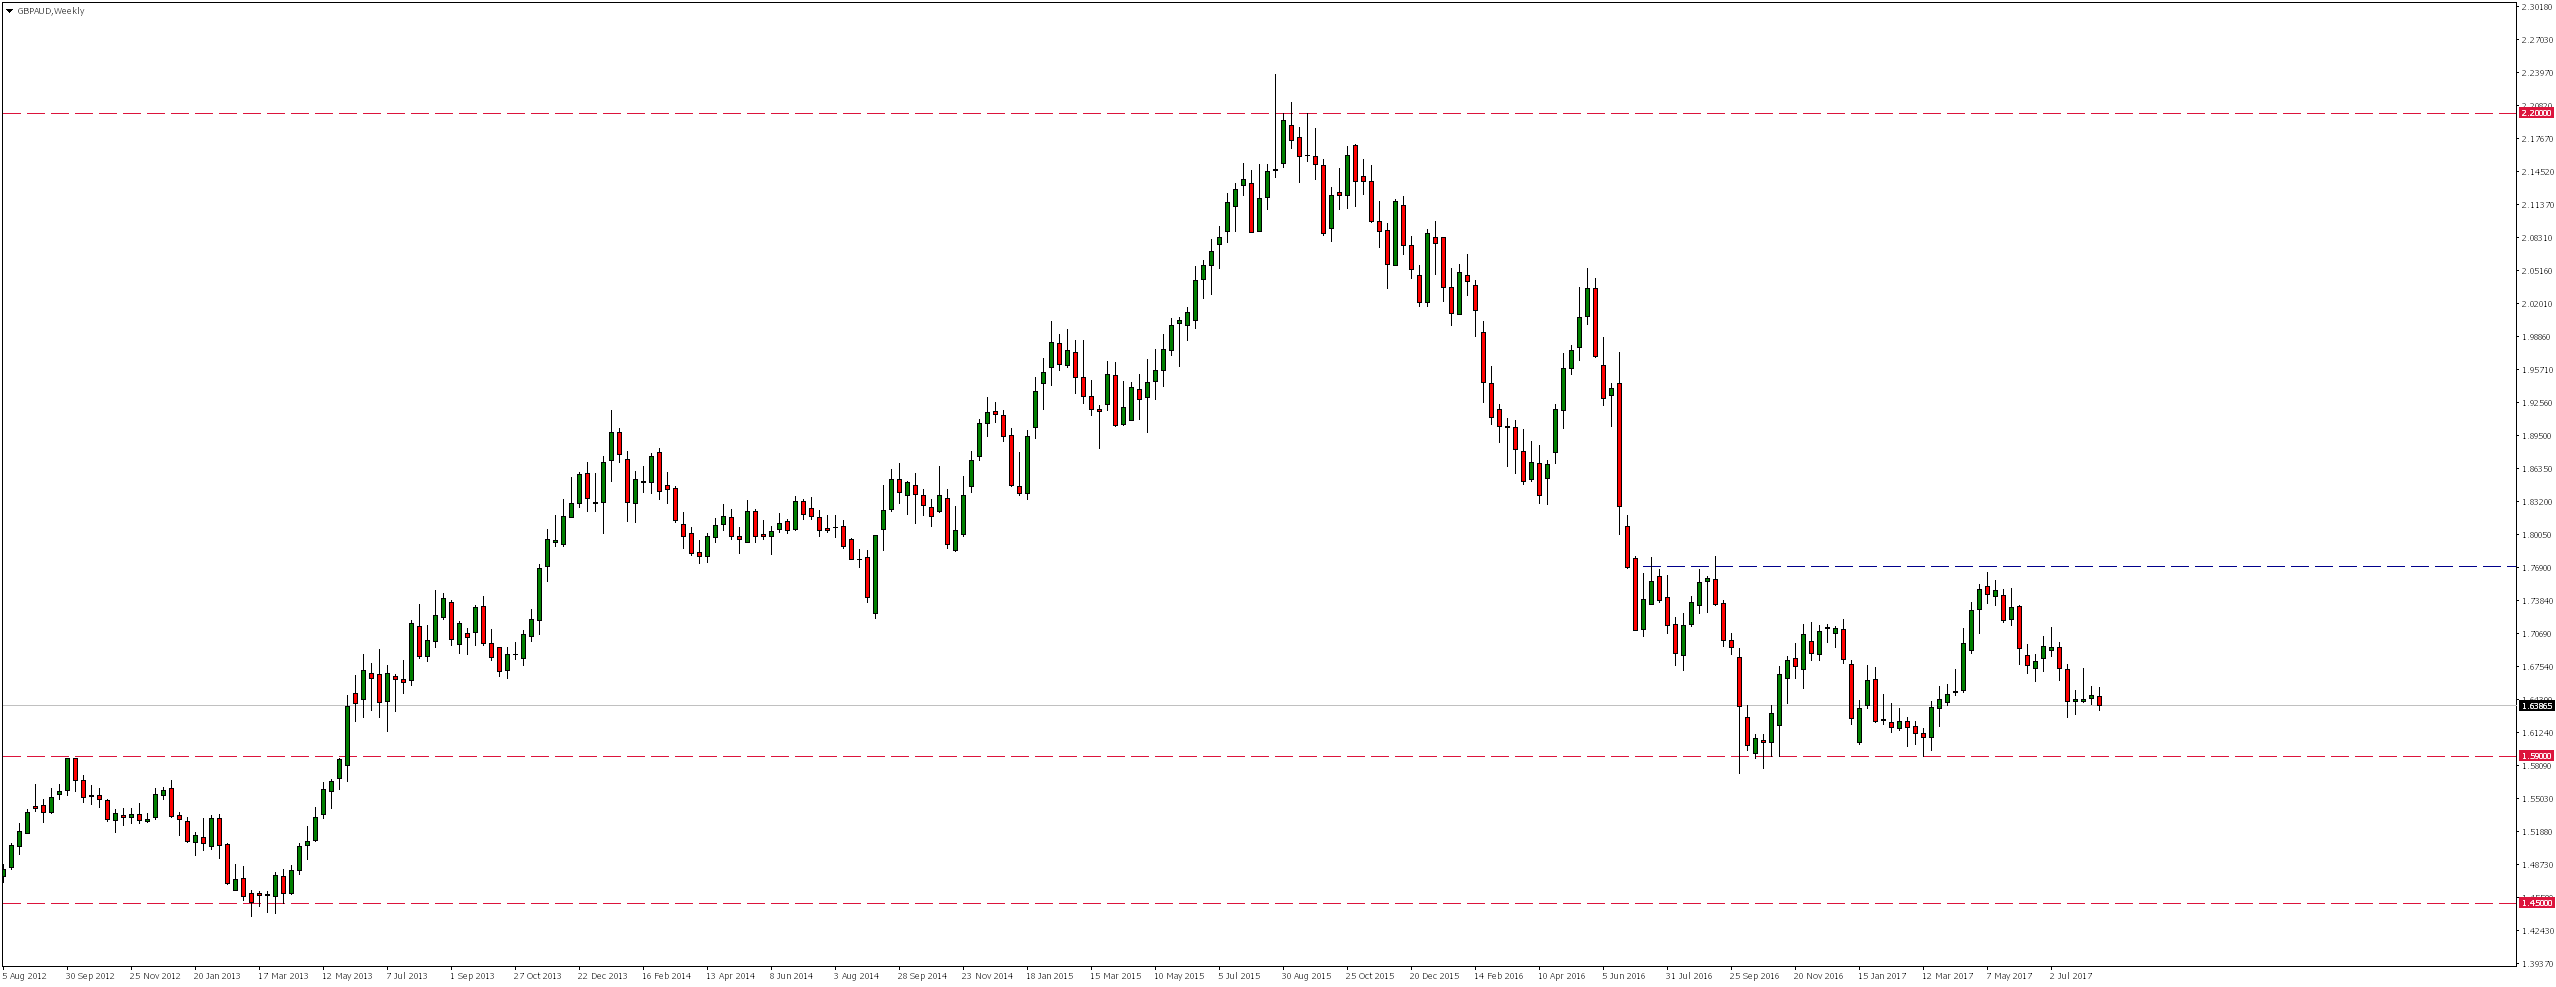
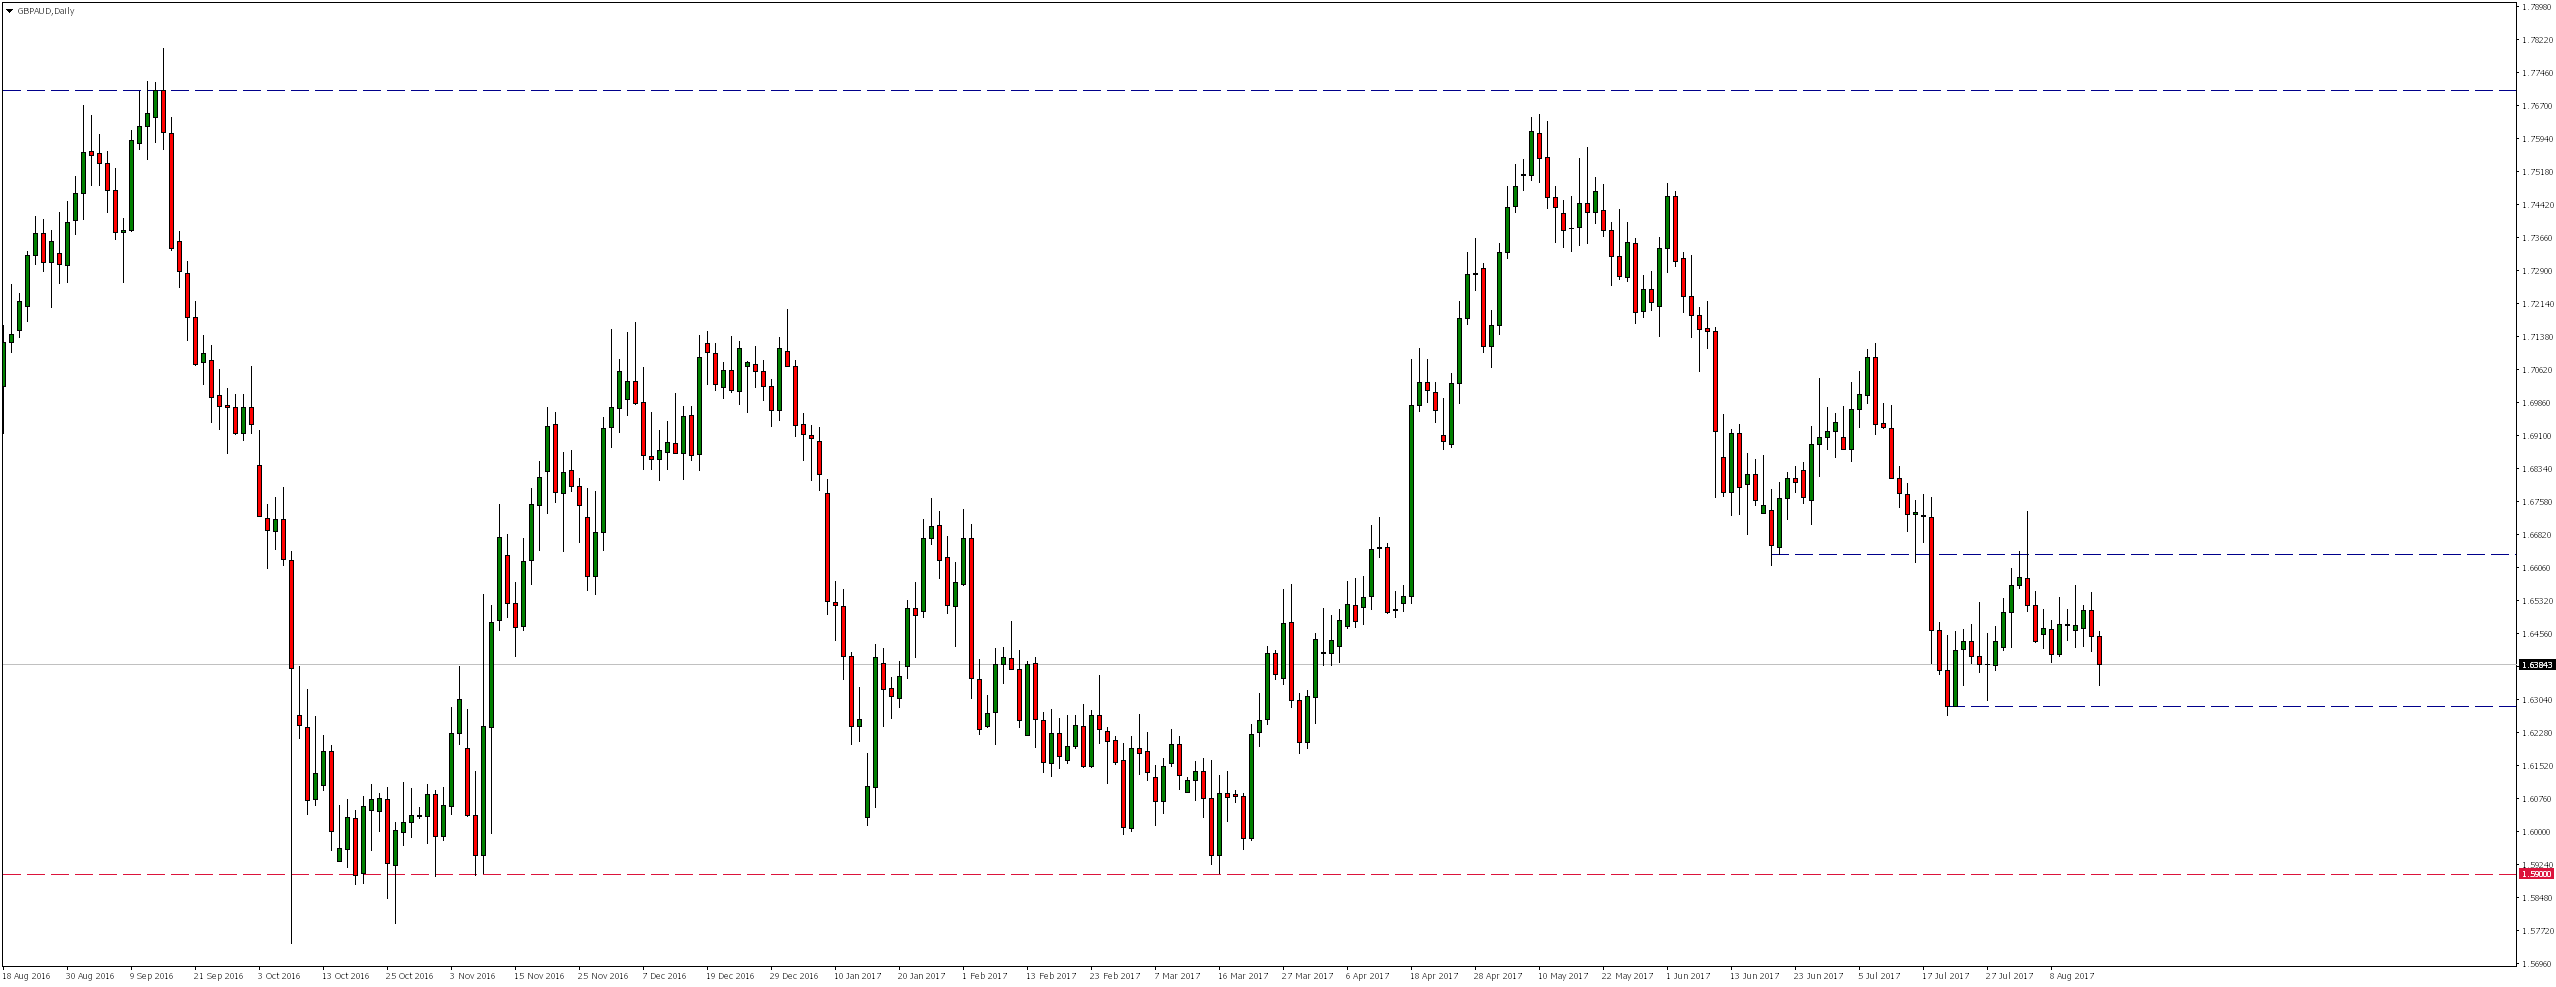
On daily chart, we note that as a result of growth lasting from July 21 market reached vicinity of local resistance, where in the beginning of August appeared supply reaction. Still, the declines did not last long. However, considering the layout of the current moves, we notice that it definitely resembles only a correction. As a result in the nearest future I would expect continuation of falls and re-testing of the 1,5900 level.
This scenario is also supported by the fact that, as a result of yesterday’s declines pair has already beaten the bullish trend line.
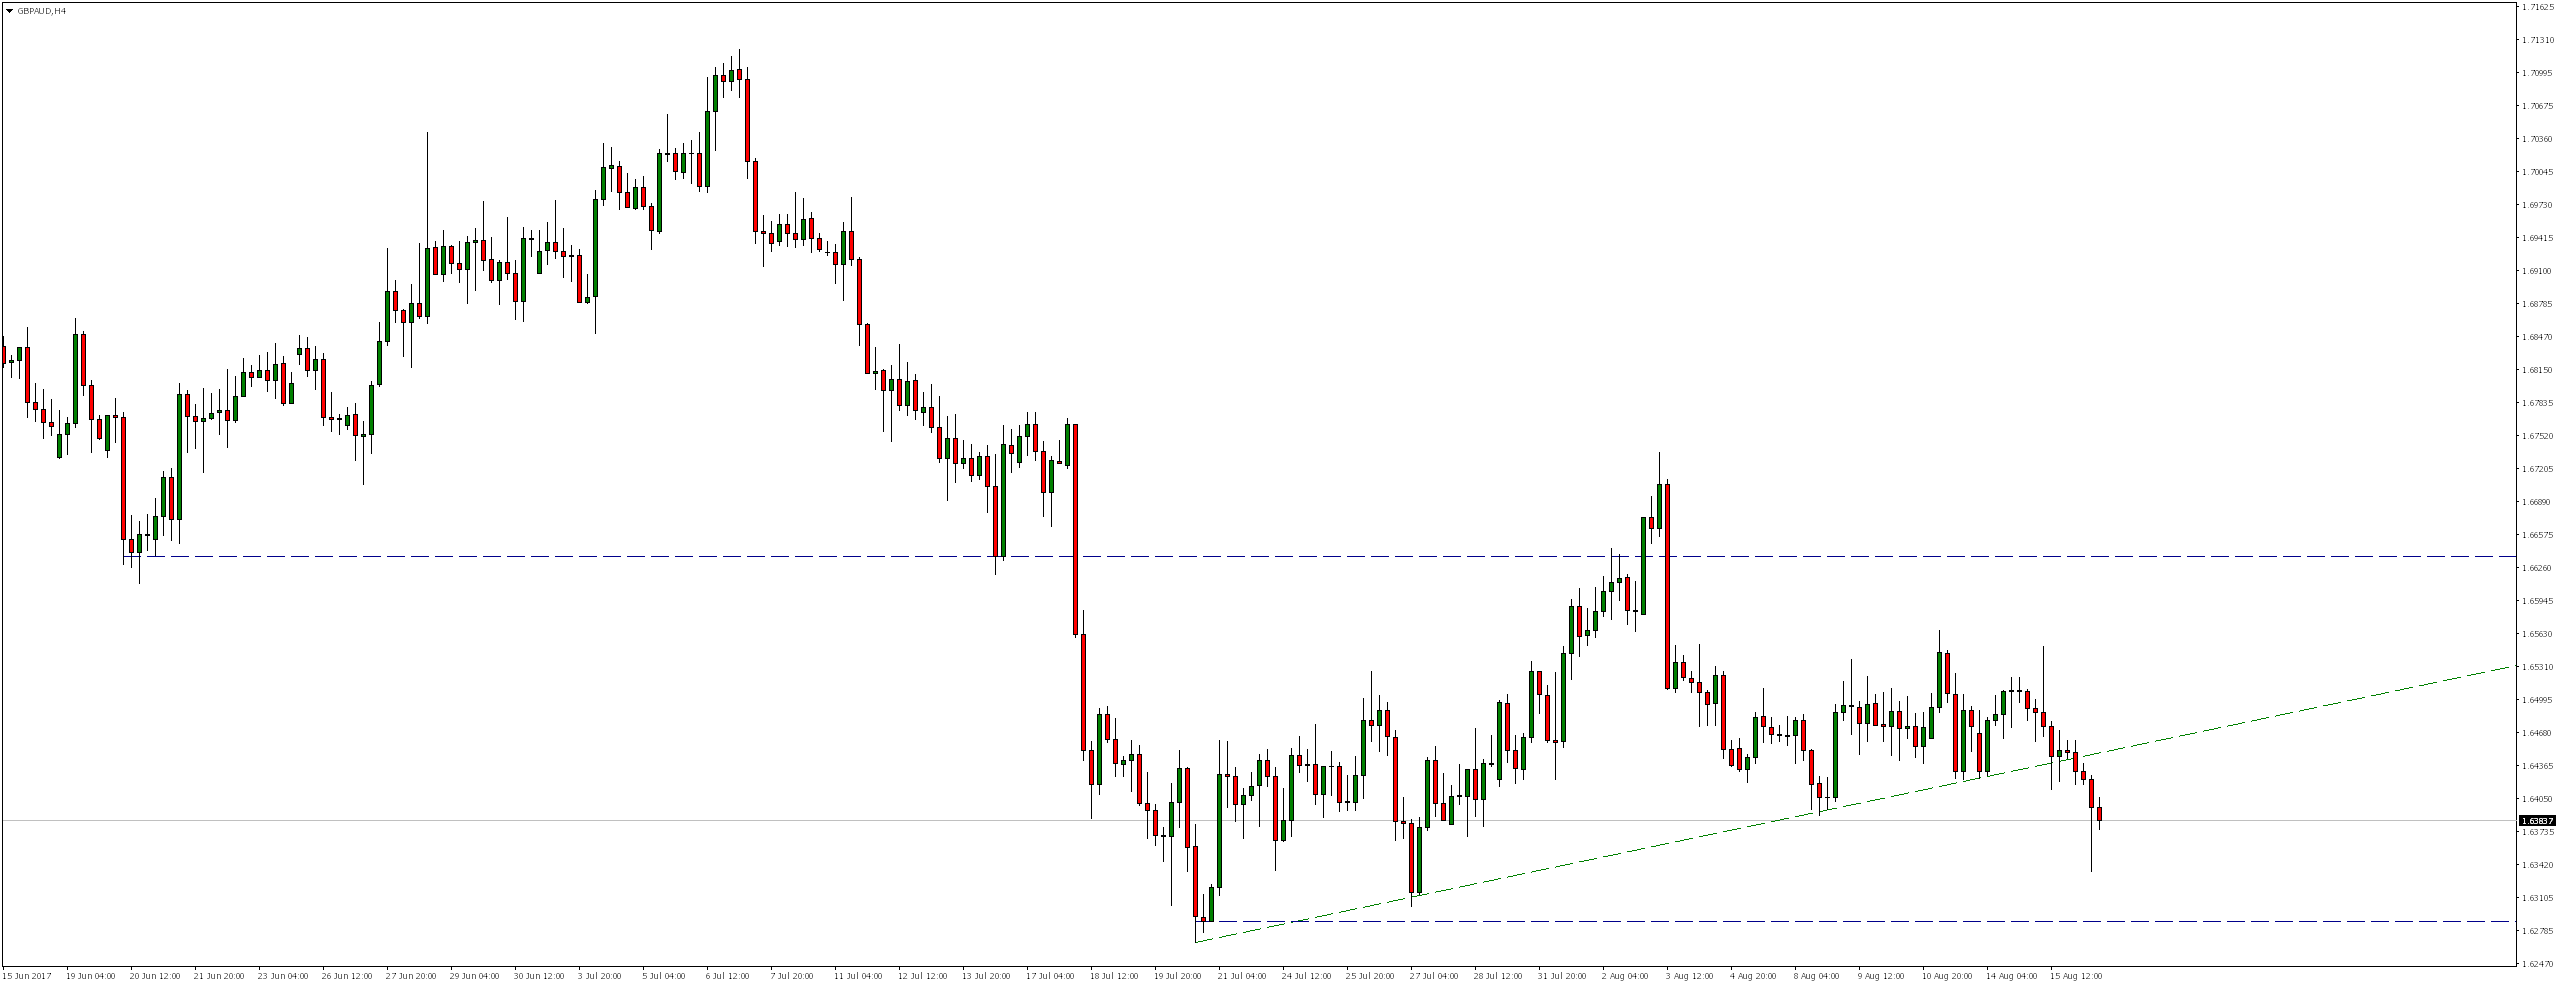
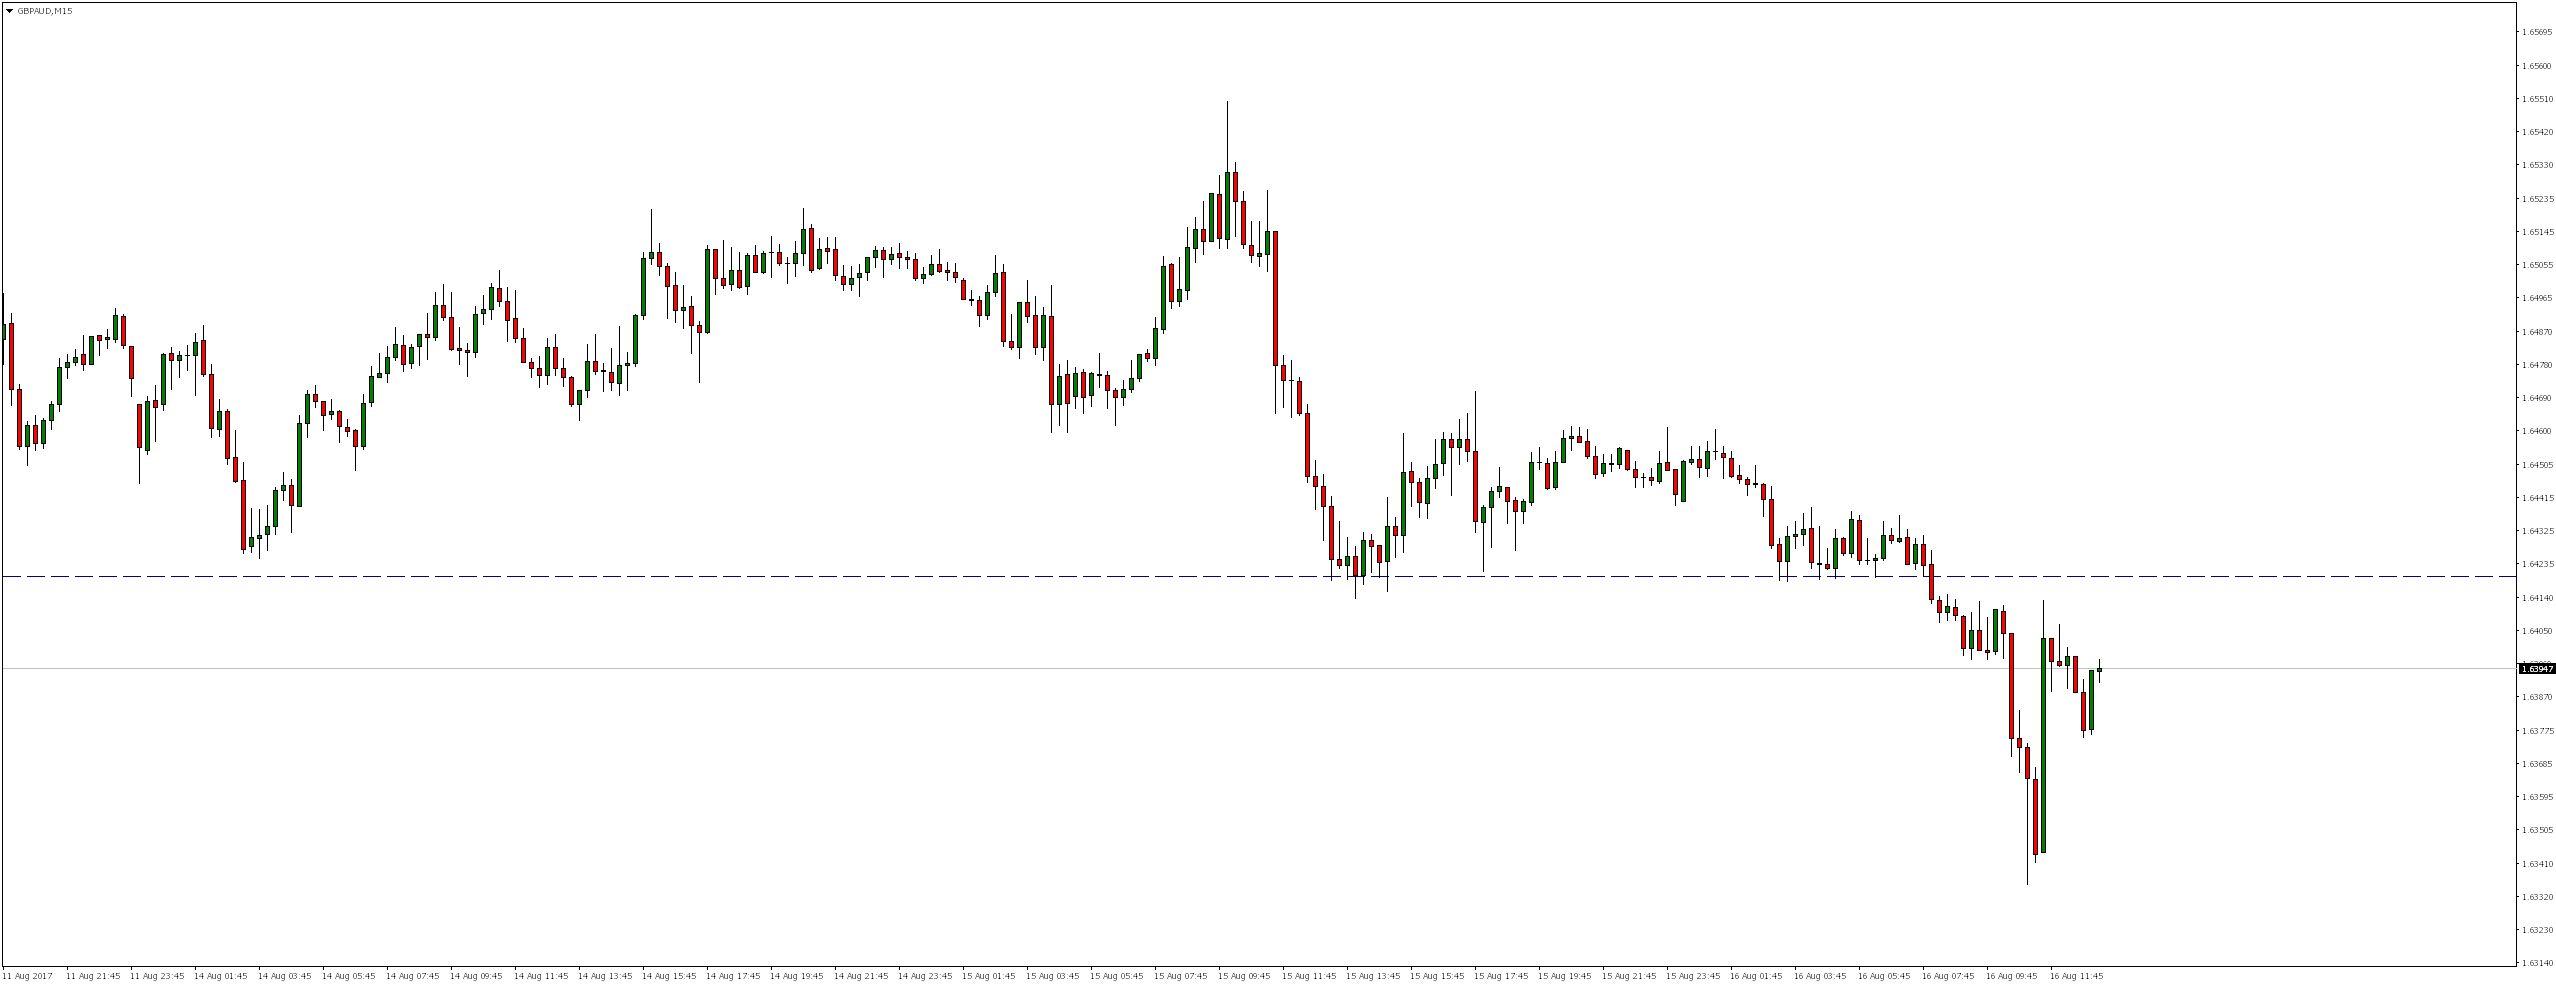
The unemployment rate in the UK slid to 4.4%, which is the lowest level in 42 years. We observed a strong appreciation of the sterling pound. If the upward trend continues, in the nearest future we would expect a re-test of 1.6420, which rejected could be a signal for continuation of declines.


 Review")


