This week will be marked by the EU summit and decisions on the trade agreement between the EU and the UK after its final exit from the EU. Trying to predict the movements of these currencies with a technical analysis in view of upcoming political and economic events may fail.
When confronted with the news, every analysis is in a lost position, an example – President Trump’s recent tweet, published just after he left the hospital.
Taking into account the factors described above, I decided to take a closer look at the currencies from outside Europe. My choice fell on NZDCAD. I was encouraged to analyze this instrument by the quite clear situation on both daily and four-hour H4 charts.
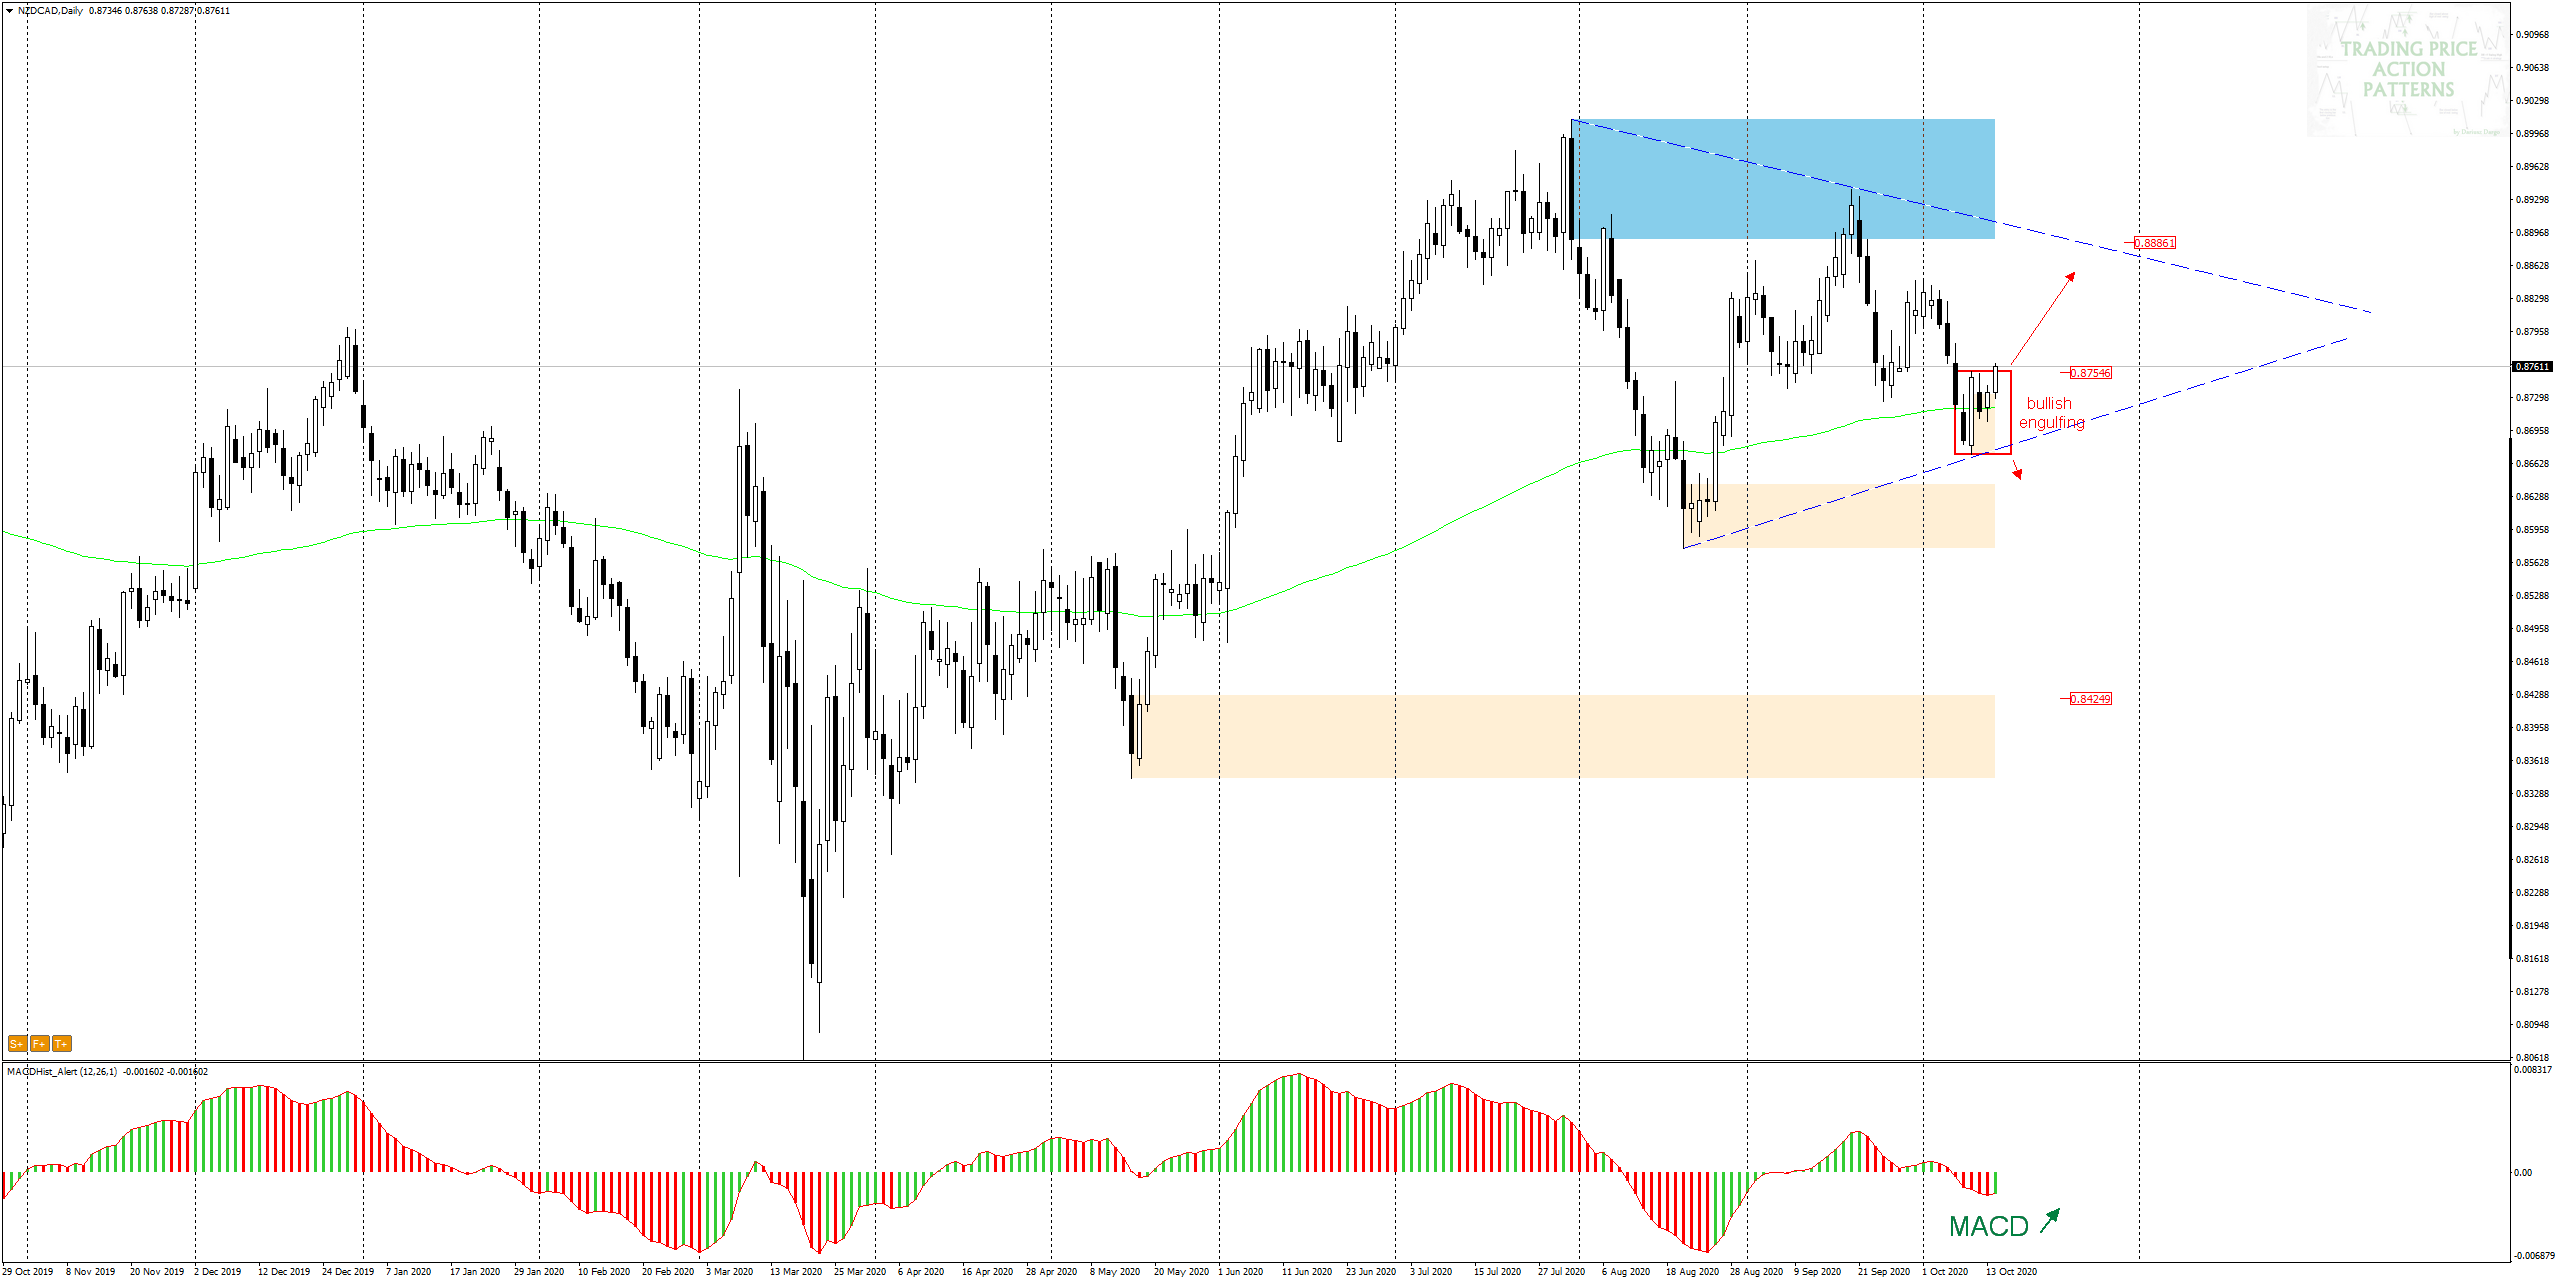
On the daily chart, the last candle of the past week together with the previous one formed an outside bar formation (bullish engulfing). Today’s price behaviour signals an attempt to break out of this pattern to the north. The MACD starts to “turn back”, i.e. it enters an upward phase.
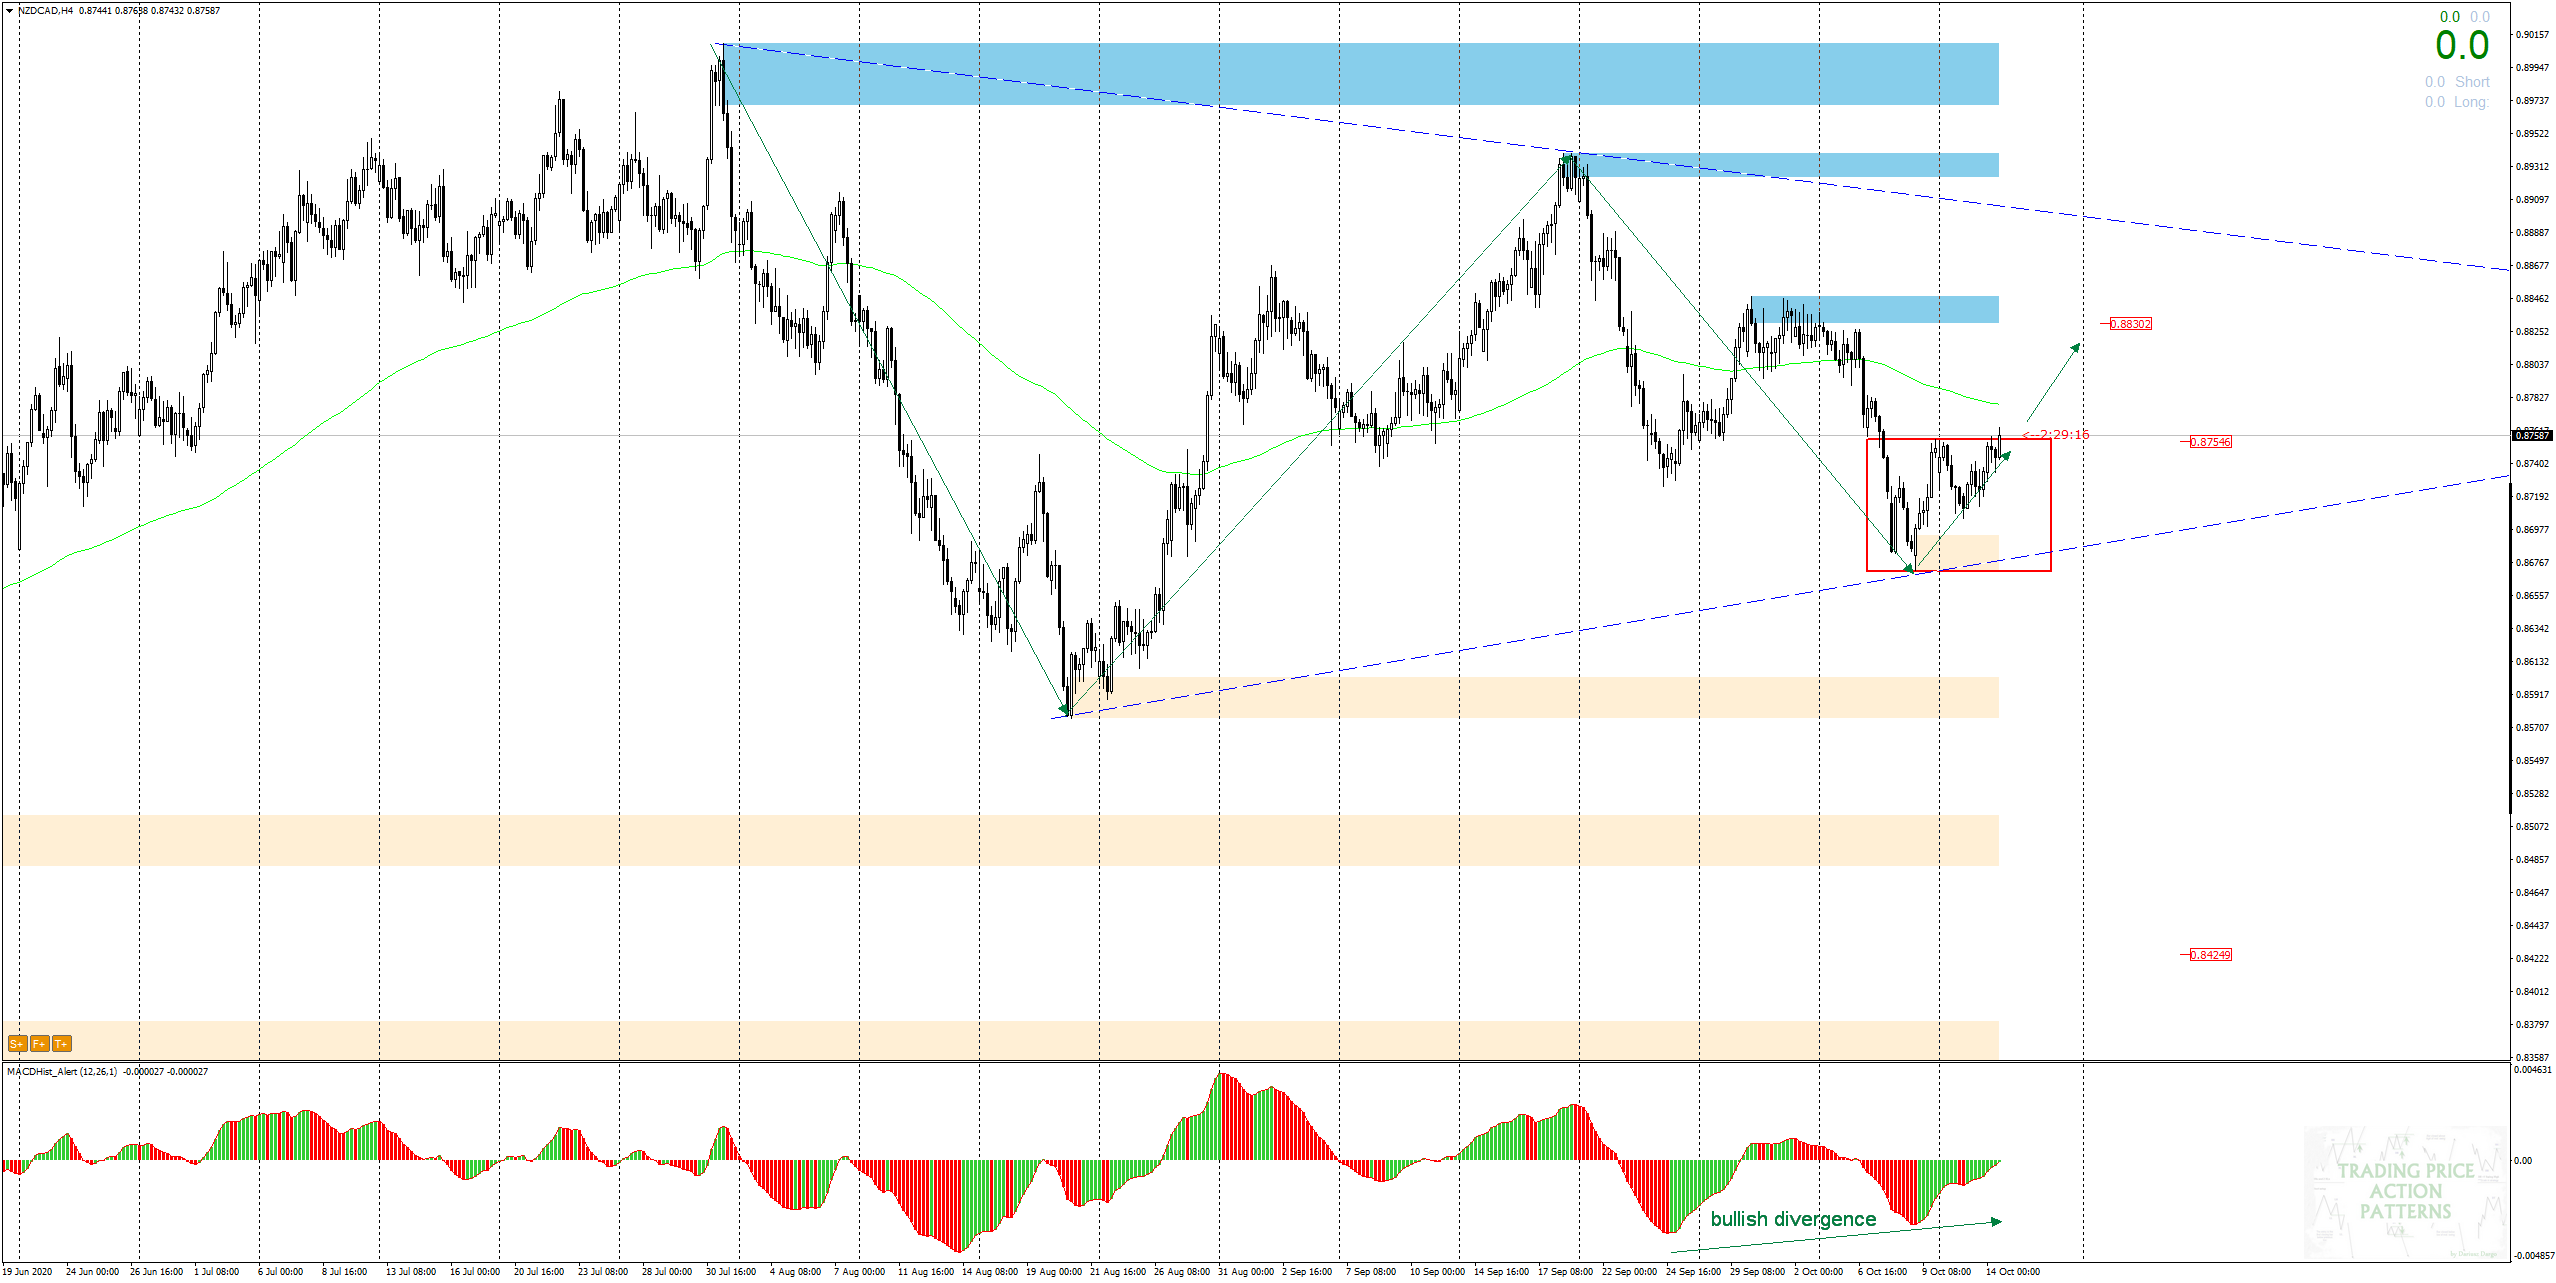
On the H4 chart I have marked the known PA formation – a symmetrical triangle, it is a bilateral formation from which the break-out can occur with the same probability in both directions. An upward divergence on the MACD is in progress, which may suggest an upward breakout. If you are tempted to indicate a demand target, it may be the nearest 0.8830 supply zone.
I also recommend:
Trading with PA+MACD, or how to increase the probability of winning
ongoing analysis https://t.me/TradewithDargo
 In our Facebook group, which you can join anytime: https://www.facebook.com/groups/328412937935363/ you will find 5 simple strategies on which my trading is based. There, every day we post fresh analyses of currency pairs and commodities. You can also visit my channel where I post my trading ideas: https://t.me/TradewithDargo


 Review")


