The USDJPY pair has been moving in an upward trend for the last three weeks and from 21.09 (104.00) to 08.10 (106.10) quotations increased by 210p.

The last maximum was the third tangent point with the trend line drawn over the peaks of July and August. When we connect the minimum of this year with the minimum of September this year. – A familiar formation – a descending wedge – will appear on the chart.
Daily candle from 07.10 along with the next one formed the Inside Bar formation. Today’s (Monday) quotations indicate a willingness to break down from this formation.
If the USDJPY quotes close today below the IB formation and the MACD enters the downward phase – there is a high probability that the declines will continue.
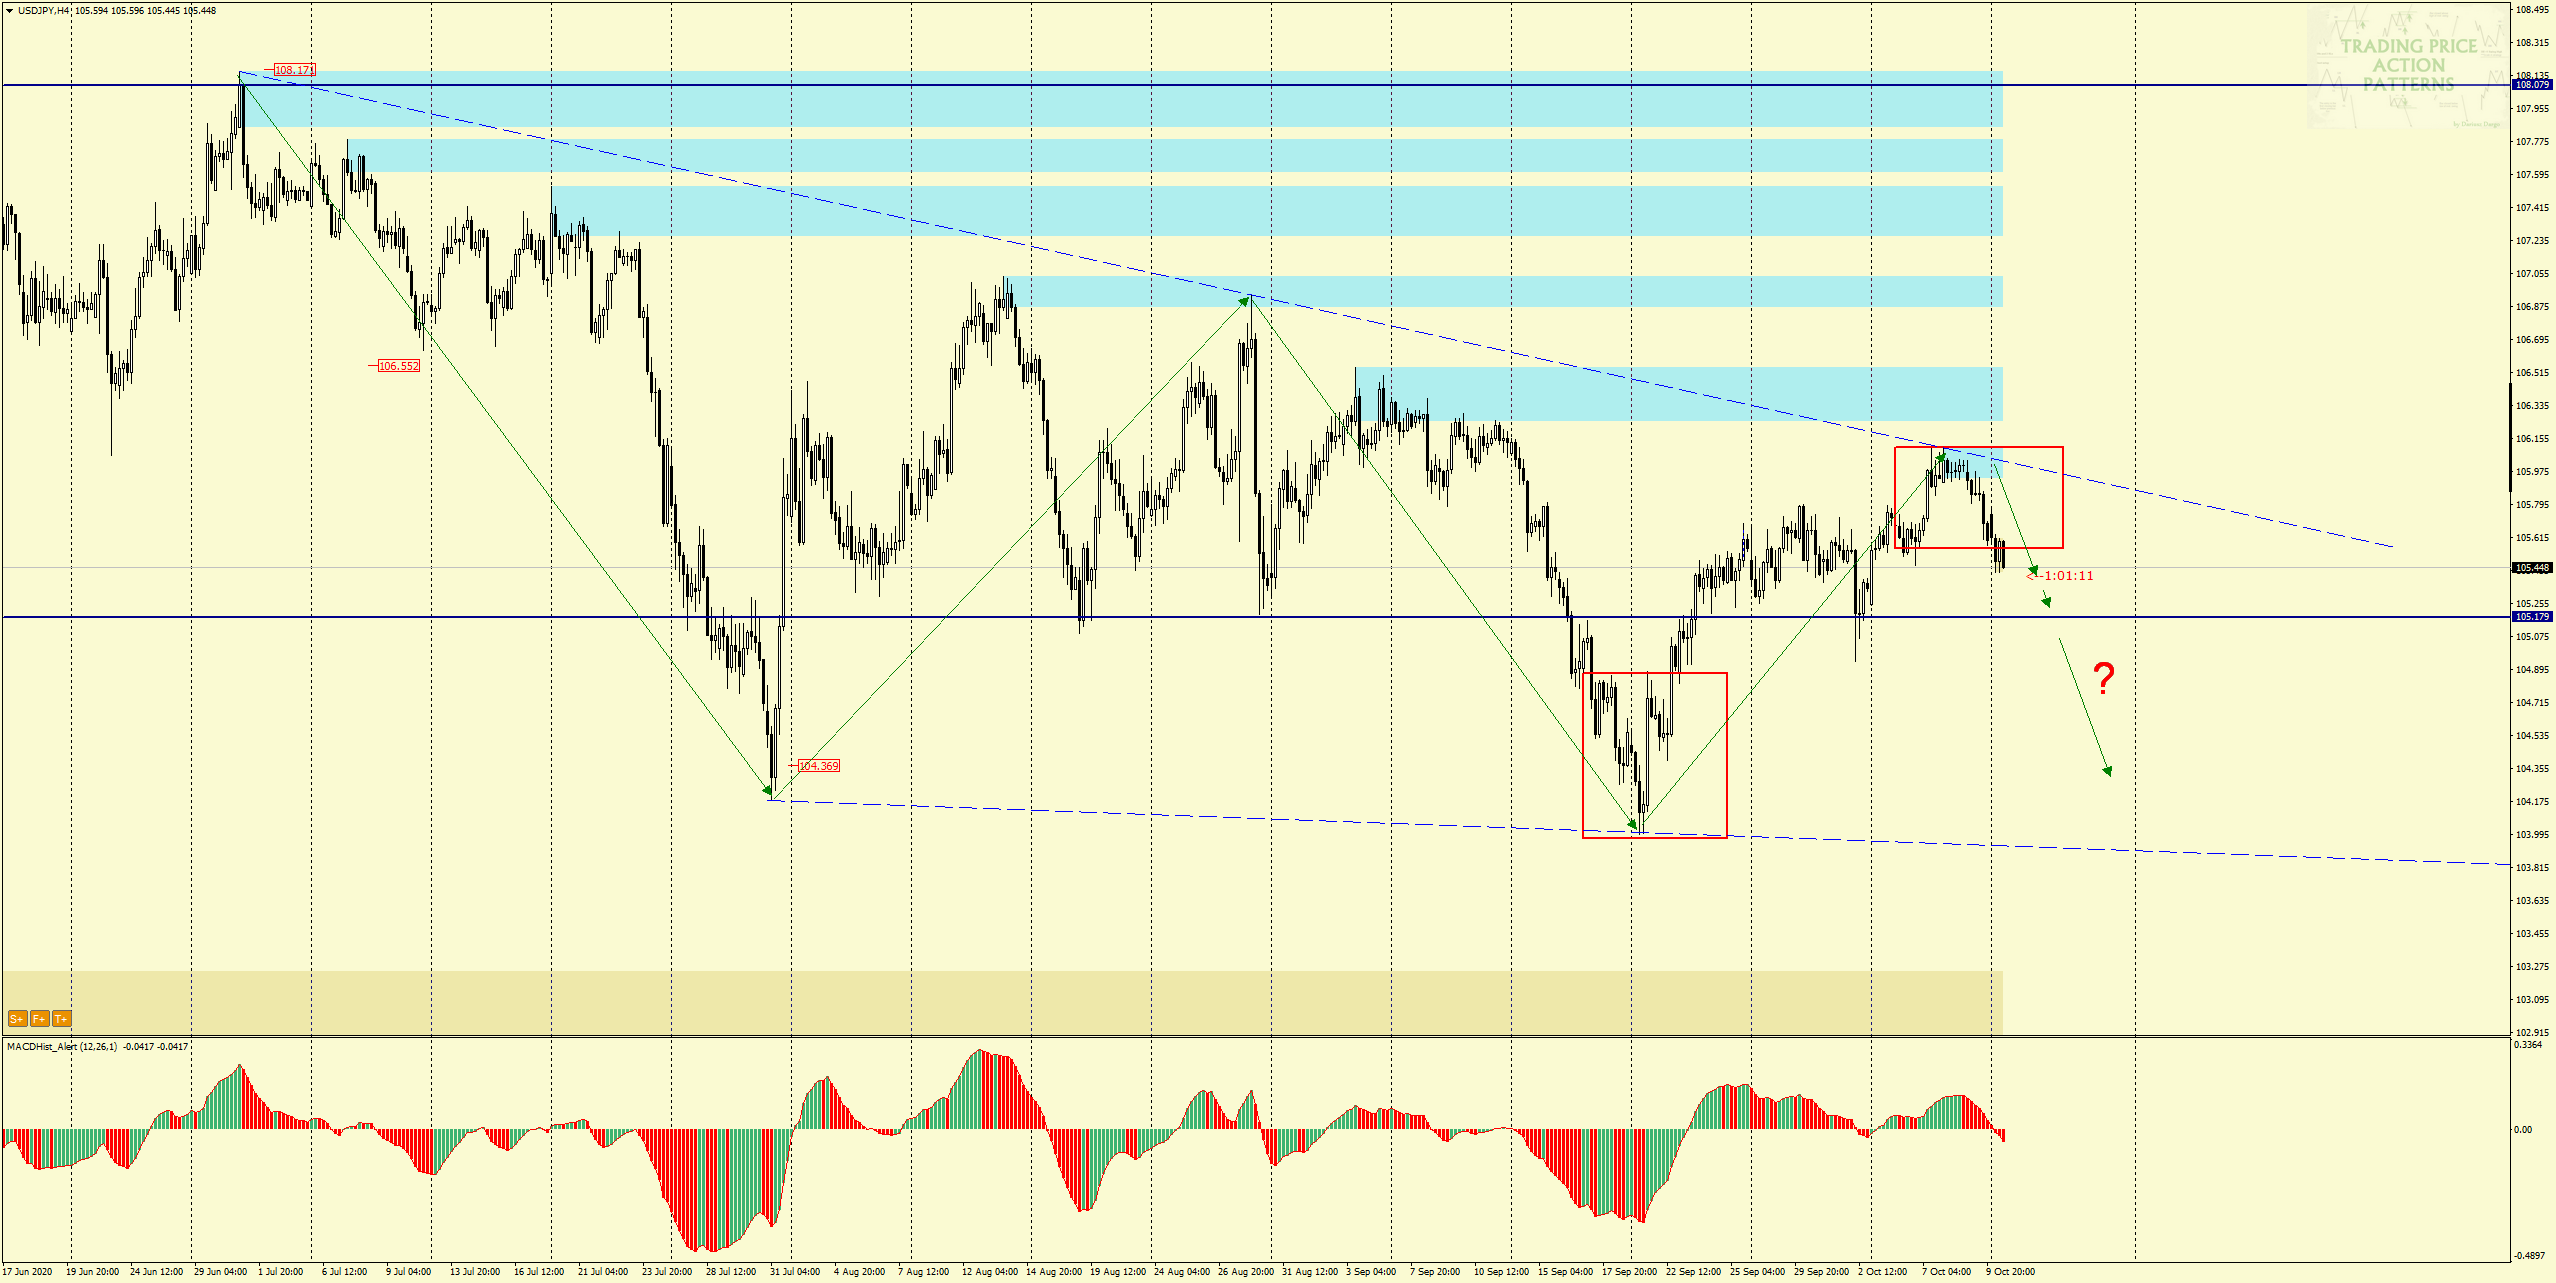
On the H4 chart I marked the wedge formation with its turning points. On MACD there is a downward divergence. If the downward scenario is to work, the first target of supply may be the local S/R level – 105.20, and overcoming it may be a signal for further dips, even around the support of the wedge formation – dashed blue line. Overcoming the wedge’s resistance negates the downward scenario.
I also recommend:
Trading with PA+MACD, or how to increase the probability of winning
ongoing analysis https://t.me/TradewithDargo
 In our Facebook group, which you can join anytime: https://www.facebook.com/groups/328412937935363/ you will find 5 simple strategies on which my trading is based. There, every day we post fresh analyses of currency pairs and commodities. You can also visit my channel where I post my trading ideas: https://t.me/TradewithDargo


 Review")


