The Brexit circus is on, the votes on successive amendments to the amendments cause so much confusion that few people already know what this is all about. The MPs do not want a hard Brexit, but do not agree with the agreement achieved by Teresa May’s government with the EU… and the time is running out, to leave the EU closer and closer to… Pat? Well, there is a saying: “United we stand, divided we fall…” so the pound generally fell into disfavour. This resulted in an invigorating breeze on the consolidated movements of the pairs and the increased volatility this week could satisfy the most demanding traders.
GBPJPY 25-30.03.2019

In Monday’s analysis “GBPJPY – Inside Bar breakout will indicate future direction – 25/03/2019″, I wrote: “On chart H4 we can see that quotations are moving in consolidation, the price is in the middle of the IB, and breaking out of the formation may determine the direction in which the quotations will follow in the next sessions. Considering that the Daily chart shows there is a downward divergence and quotes have broken twice the support of the channel, it seems more likely that the IB will be broken thru the bottom. The nearest demand zone starting at 142.50 may be a target for supply”.
Unfortunately, nothing has been clarified yet, and the price for the whole week was thrashing within this 220p Inside Bar. As the downward divergence on MACD on the daily chart continues, perhaps the next week the IB support will be defeated and the price will go southwards. Certainly, reports from the British Parliament will have a big influence on the future of the quotations.
GBPAUD 28-30.03.2019
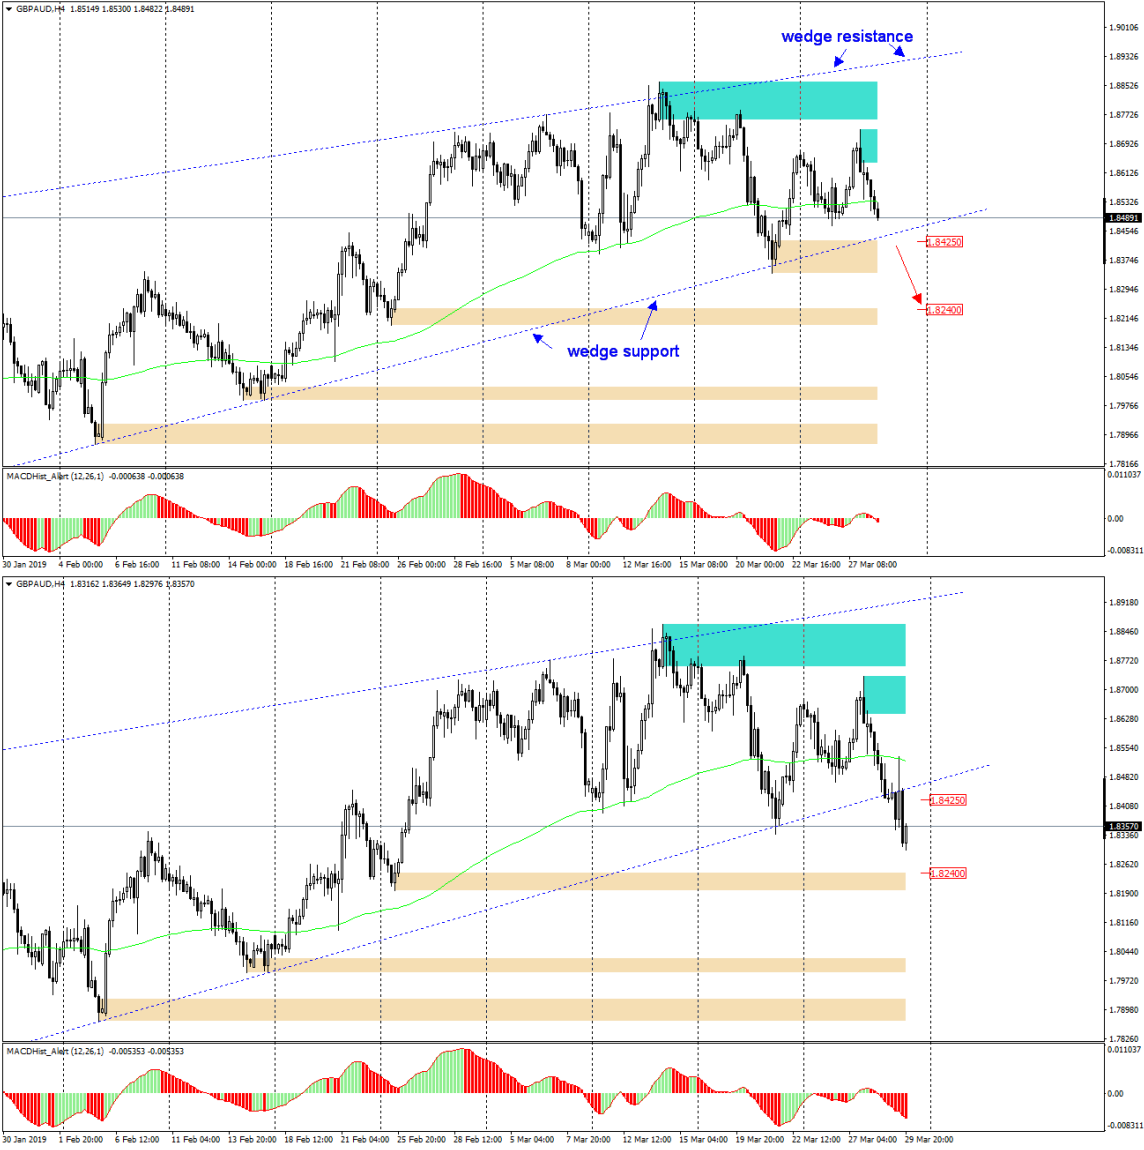
I had already analyzed this pair on 10 March, when I predicted a decline in the direction of the upward trend line, which at the end of the month became a support for the upward trend wedge.
On Thursday’s analysis – “GBPAUD – Will the wedge support withstand supply pressure?” I wrote: “On chart H4 we will notice that the price is moving towards the nearest demand zone, which starts at the level of 1.8425, and also there is currently the support for the aforementioned upward trend of the rising wedge formation. Overcoming this support can be an impulse for further declines, and their range in the first movement can reach 180p”.
Here, in contrast to Monday’s GBPJPY analysis, the realization was very dynamic, because already during the Asian session there was an attack on the support of the ascending wedge mentioned in the analysis. The ideal signal to join the declines was the appearance of a candle with a long upper wick (in Chart H4), the maximum of which reflected from the average EMA144. The price fell below the wedge and everything indicates that this is not the end of the falls, which are supported by the growing threat of hard Brexit after another vote in the UK parliament, lost by Teresa May’s government.
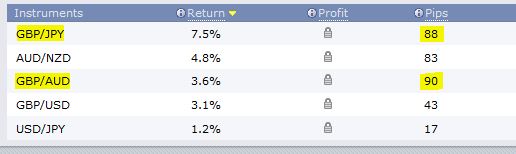
In line with the above analyses, it was possible to close the week with a profit.


 Review")


