GBPAUD D1

Since December 2018 GBPAUD has been moving in an upward trend and quotations are within a channel range of about 700p. After setting the maximum this year at 1.8766, the price started to fall. The last two sessions of last week were clearly bearish, and the failure to beat the previous maximum of 10.10.2018 may indicate a clear advantage of supply.
In order to determine the level of entry into Sell’s order, we have to look at the lower time interval. From chart H1 we can deduce that the best moment to join the supply will be around the average EMA144, which previously served quite well as dynamic support and at the next contact with the price should act as a dynamic resistance – and this is a version for those who like risk.
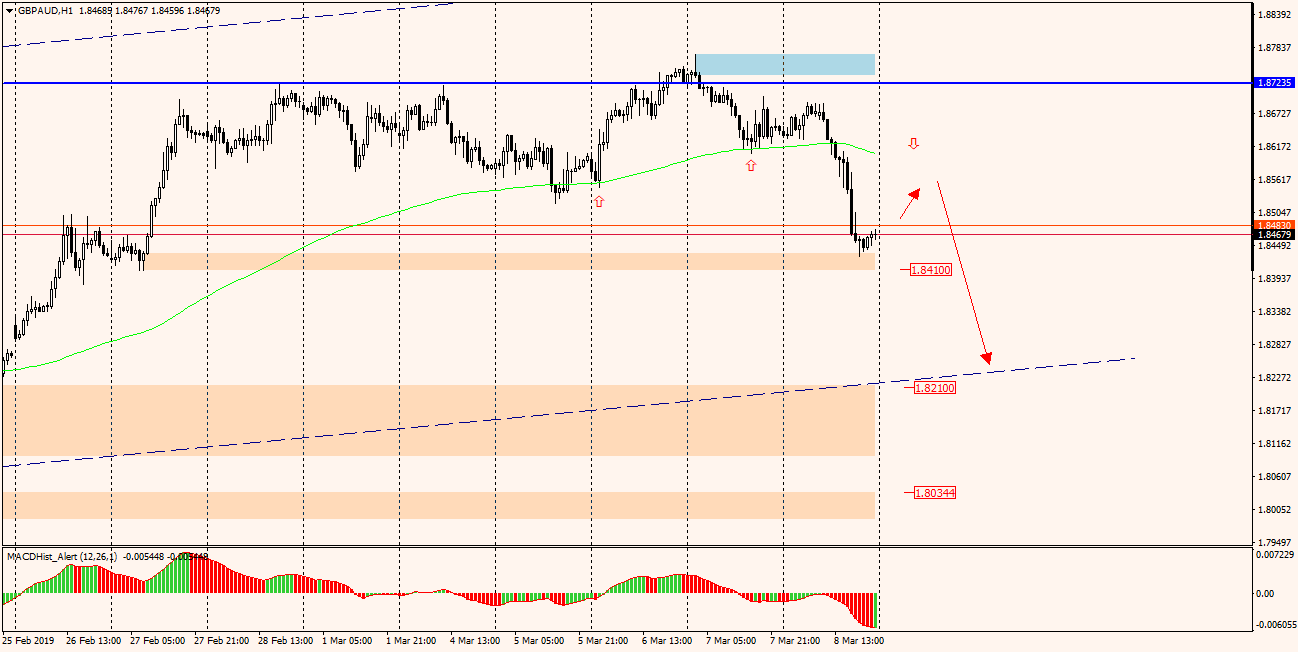
More cautious and conservative traders will probably join the sellers only when the price overcomes the currently tested support 1.8410.
The goal of supply may be the support of the channel mentioned at the beginning, which is at the same time a bullish trend line, currently located in the area of level 1.8210.
Tuesday’s vote in the UK Parliament on Brexit should also be borne in mind, the outcome of which may shake the GBP exchange rate in a way that is difficult to estimate at the moment.


 Review")


