The week No.10/2019 is coming to an end, with noteworthy events, it is surely hard to overlook the ECB meeting and the monthly “payrolls” in the USA. The first event brought a weakening of the euro – poor forecasts for GDP and inflation, combined with the fact that the TLTRO will end not sooner than in March 2021, strongly influenced the imagination of investors – already in the afternoon the estimates for the increase in rates moved from March to June 2020. The second event – despite a very low reading of 20,000 with the expected 180,000 new jobs in the non-agricultural sector, did not significantly weaken the USD. Bearing these two events in mind, I focused on analysing crosses without EUR and USD, on which the volatility is lower, not so dependent on those data.
CADJPY 03-08.03.2019
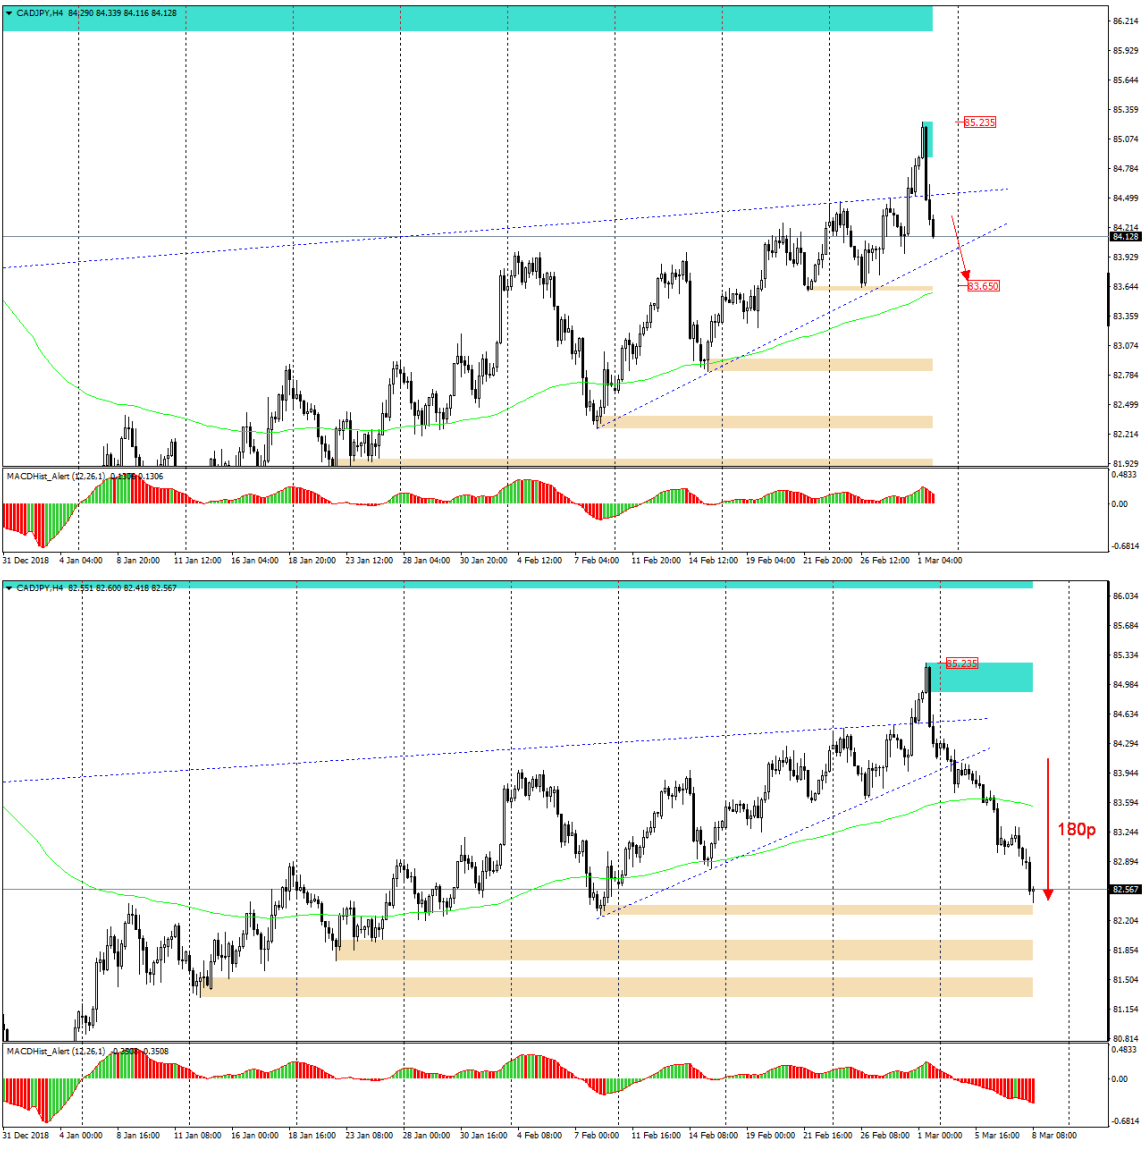
In Monday’s analysis – “CADJPY – long term trend line rejected” I predicted drops: – “Last week notations formed a candle with a large upper wick indicating the rejection of an upward trend line drawn from 2016 and 2018 minimum. Analyzing the four-hour chart we will notice that the price is approaching the local trend line since the beginning of February this year and its overcoming may lead to further drops to the nearest demand level of 83.65 “.
The analysis turned out to be as accurate as possible, the decreases occurred and their range significantly exceeded initial estimates as the price fell to GBP 82.30CHF
GBPCHF 05-08.03.2019

On this pair of quotations ran more surprisingly than on CADJPY and for a long time did not want to meet my expectations as to direction and range. In the analysis “GBPCHF – Bearish Engulfing and divergence on Daily” I wrote: “Today’s daily candle covered Friday’s range, creating the Outside Bar –Bearish Engulfing, which, located close to the last high, according to the PA+MACD strategy, may be a sign of further declines. The downturn scenario is also supported by the divergence on MACD, which already appeared on Friday on the daily chart. A confirmed breakout from the OB may be a signal to continue the falls initiated last week.”
Subsequent sessions indicated a struggle between demand and supply, the price initially broke down than returned to the OB and then pop over the formation for a short time. The market turned back several times within the OB in an attempt to dissuade me from an open short trade, but the ongoing downward divergence on the D1 prompted – “Keep it, they will fall”. And I saw it, because Friday’s “payrolls” added confidence to the supply and the price finally left mentioned in the analysis “engulfing bar”. The drops are continuing and there is a high probability that they will reach soon the nearest demand zone at 1.3030. So in case of a correction it can be a good trade to sell to this level.
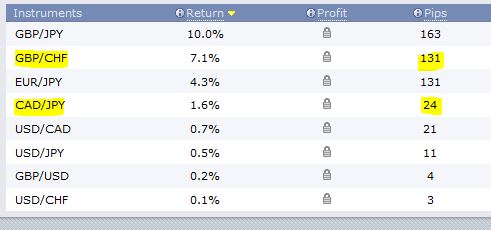
This week’s pips:
Join us in our new group for serious traders, get fresh analyses and educational stuff here: https://www.facebook.com/groups/328412937935363/


 Review")


