Investors/Traders are constantly on the lookout for better and more effective indicators. Better indicators lead to better signals. One of the most basic indicators is the moving average.
Moving averages
Most traders use, or at least are aware of, moving averages. The main advantage of using a moving average is its simplicity. The ability to interpret signals is what sets traders apart and the use of moving averages is no exception.
A moving average interprets the markets trend by showing and properly understood reveal when a reversal occurs.
As with any statistical analysis, there several diverse types of moving average. The term “moving average refers to the fact that the average is for the number of periods back from the current price.
For example, on an hourly chart the 8 versus 21 MA will show the last eight versus the last 21 hourly closings. Moving forward the oldest price is removed from the calculation.
Example
To calculate moving average from last 8 days closing prices, we add closing prices from last 8 days and divide by 8. Similarly, to calculate a moving average from the last 21 hours, you just add last 21 closing prices and divide by 21.
4 8 6 7 9 11 10 15 12 13
(6 + 7 + 9 + 11 + 10 + 15 + 12 + 13) / 8 = 83 / 8 = 10,375
When a new period is added, the oldest price is removed from the calculations (6 in this example) and the most recent one is added (15):
4 8 6 7 9 11 10 15 12 13 15
(7 + 9 + 11 + 10 + 15 + 12 + 13 + 15) / 8 = 92 / 8 = 11,5
In this example, closing prices were used. This is the most popular method used to calculate a simple MA. There are several variations (see below) which provide differing results and are used in separate ways.
When two or more averages are used, (for example high and low) a channel of averages is created illustrating the average price fluctuation.
Types of Moving Averages
Other than the actual variety of price used in moving averages, analysts also use a variety of average types. They use differing formulae to create the data. There are four main variations:
- Simple Moving Average (SMA)
- Exponential Moving Average (EMA)
- Smoothed Moving Average (SMA)
- Weighted Moving Average (WMA)
The most commonly used are the simple and exponential
Simple Moving Average (SMA)
SMA was already described in the beginning of this article. I just remind that this is arithmetic mean of prices from specific period before. It is called moving because each new value excludes from the formula the oldest one.
Exponential Moving Average (EMA)
This is a faster moving average than the SMA. The basic feature of this indicator is fact that recent values are more highly weighted than older ones within the data so it is more accurate in illustrating the current sentiment of the market. An EMA faster reacts to changes than SMA.
Old EMA values are not discarded, they just gradually lose significance so eventually, they are not considered at all. An EMA is usually calculated based on closing prices.
To better illustrate the difference between simple and exponential moving averages, it is good to compare SMA to a tortoise and EMA to a hare.
An SMA is a slow-moving average (Tortoise). It reacts slowly to change of price and is smoother to look at. For that reason, it can prevent from false price movements.
A disadvantage is that a slower indicator can delay decision making since it takes longer to verify the signal. A Turtle is slow, traders can miss entering a move at its inception. However, it has a “protective shell” which helps to not opening wrong positions too soon.
EMA is faster moving average (Hare). This MA quickly responds to price changes. It helps in quick detection and identification of a trend. This can bring bigger profit. An EMA is as fast as a hare, so it helps catch the beginning of the trend, but there is a much bigger possibility of a wrong interpretation.
Which average is better?
This question refers to the type of trader posing the query.
There is no clear answer.
The EMA needs verification before a trade is contemplated since it throws up several false signals. On the other hand, the SMS gives less signals but they are far more accurate.
Using moving averages
Moving averages are extremely useful technical analysis tools. In addition to setting the current trend, they can show its strength, illustrate support or resistance levels and point potential signals to enter position.
First, turn on one moving average on a chart. Interpretation is simple. If the price is above the average and is pointed up, the asset is in a bullish trend. On the other hand, if price is below average and it is pointed down, the trend is bearish.
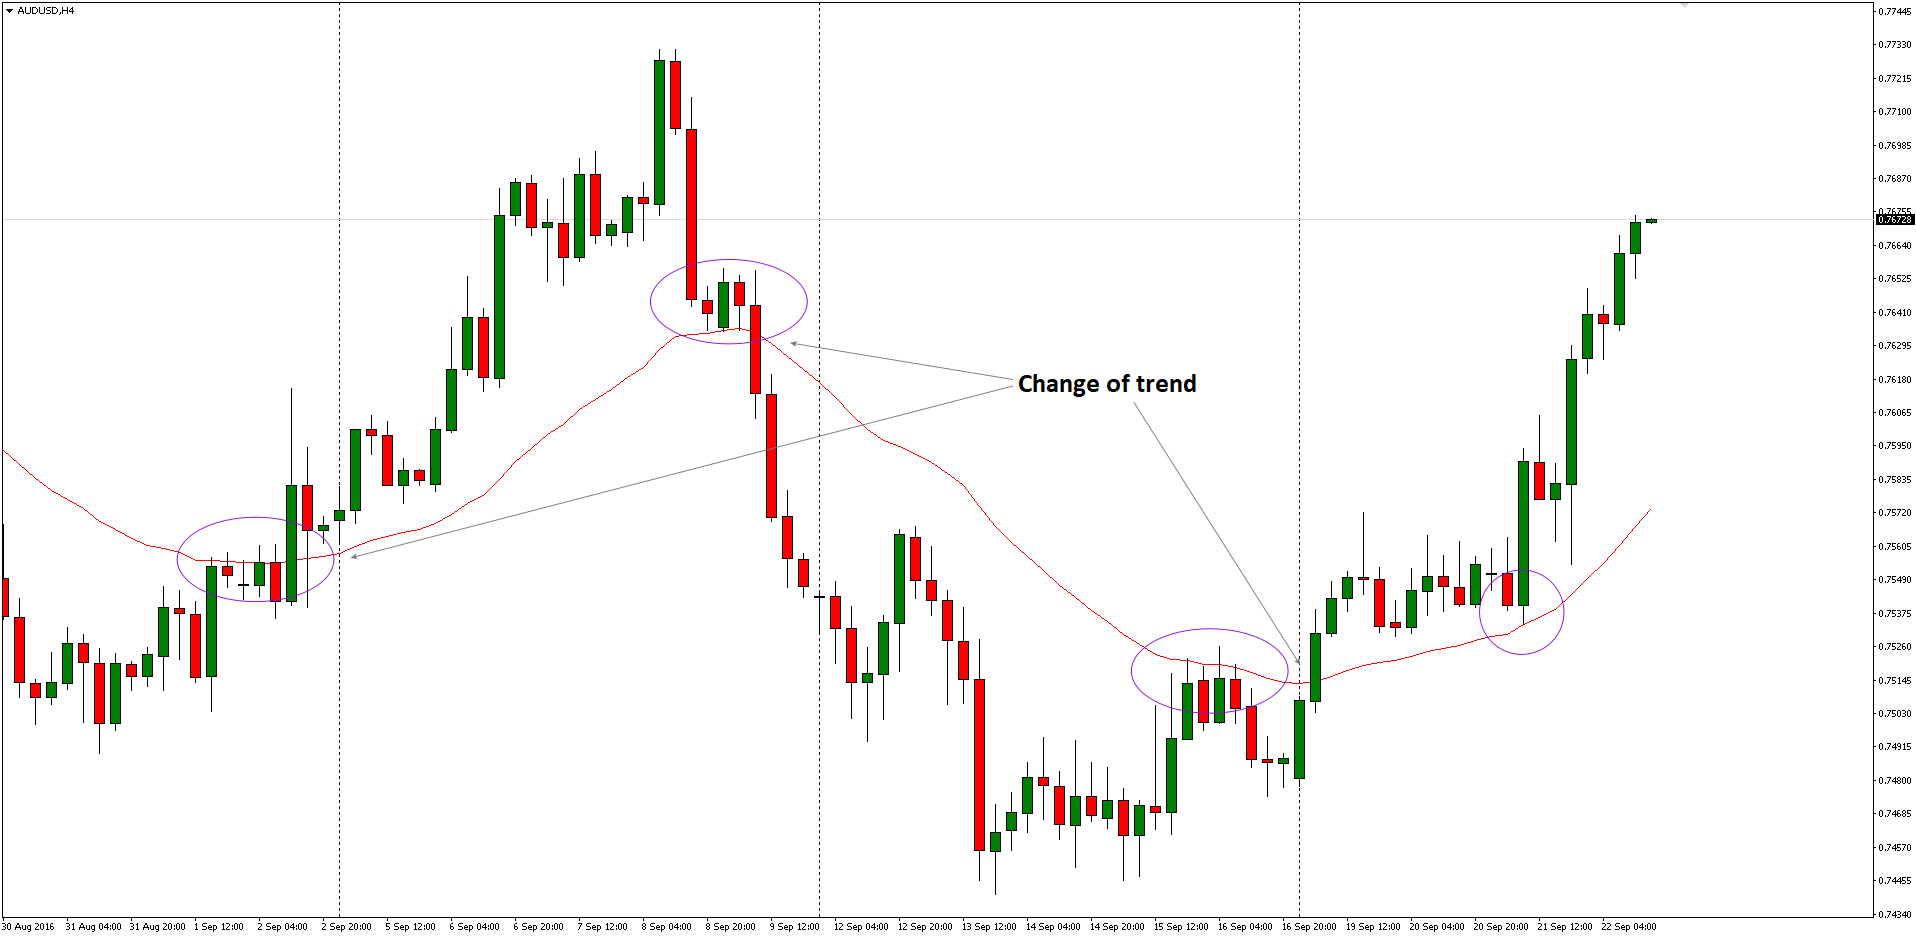
Next, use two different averages (faster and slower). If the quicker one (blue) is below slow one (red), then the trend is bearish. Faster and slower refers to the time interval, faster being the shorter time interval. The trend changes when the two averages cross. Depending on periods used in creating those averages potential signals are stronger or weaker.

A further way of using MAs is to create a channel. Interpretation is the same as in case of a single average.
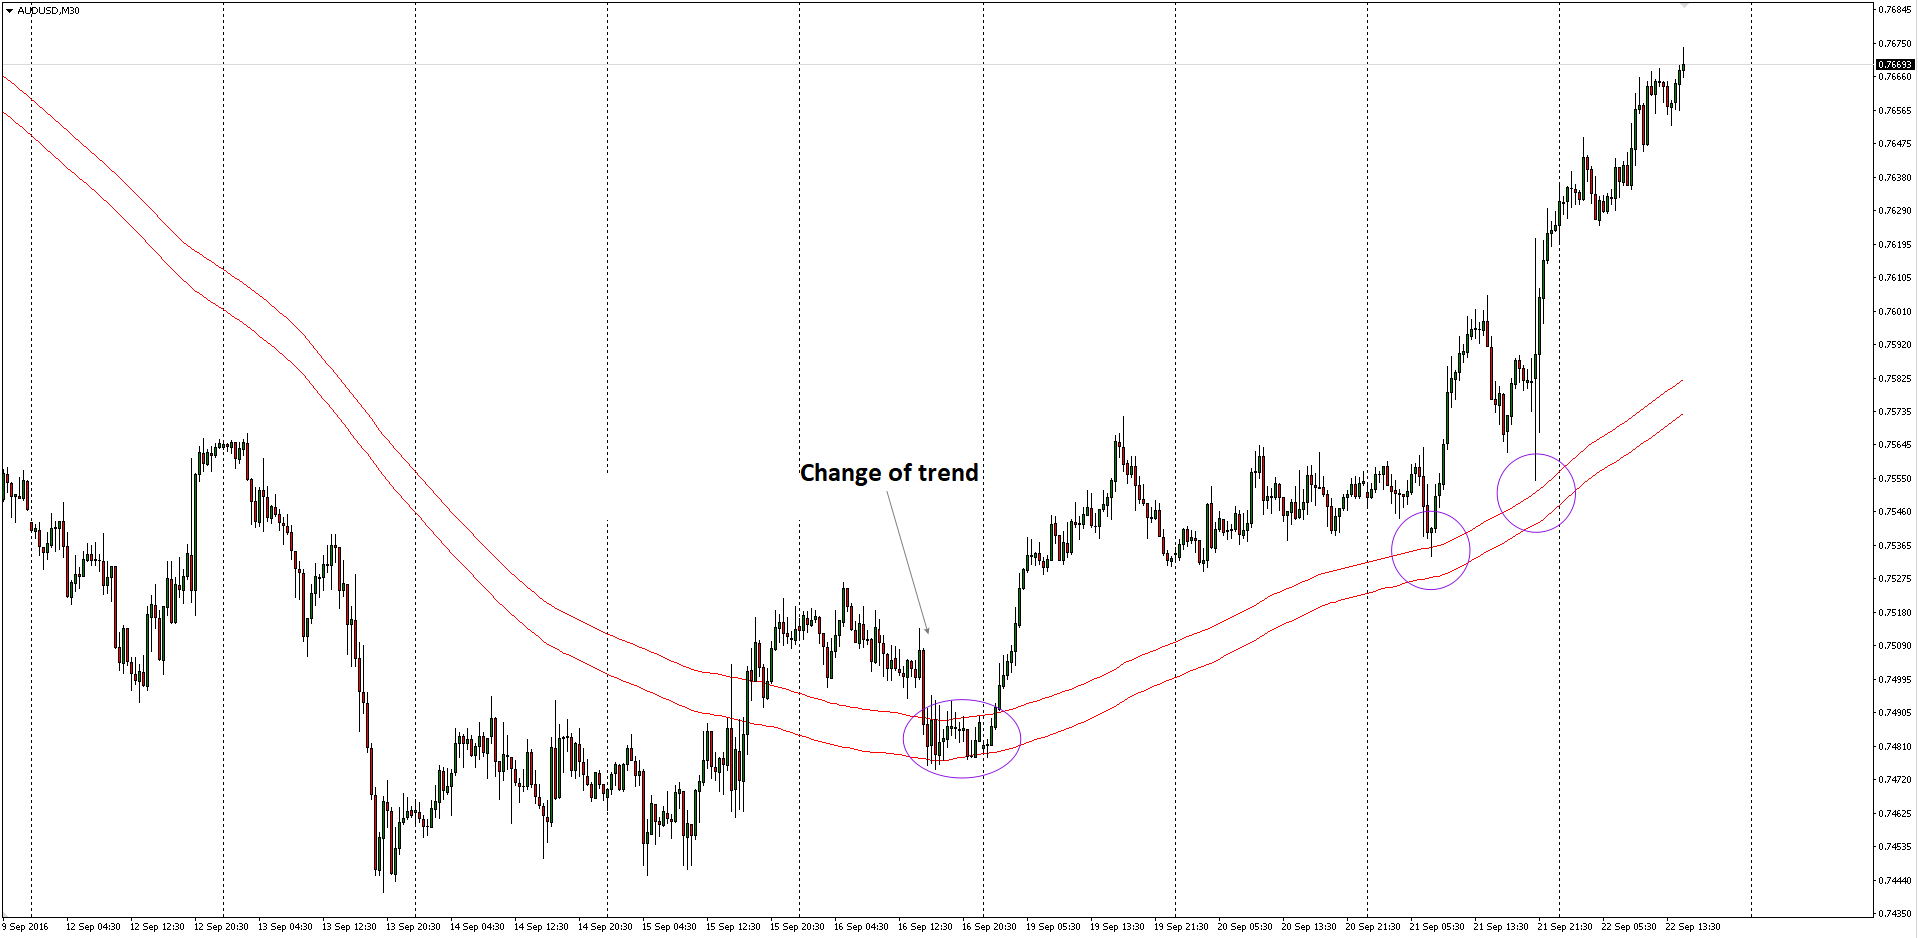
The angle of the moving average is an aid to determining the strength of the trend. They can also determine support and resistance levels.


