Two weeks ago I analysed AUDJPY when on the weekly chart a demand pinbar was created, which indicated a bullish attitude on this pair.
In fact, following the pin bar, the price has grown to a key resistance within 84.32, which was the first target. However, as shown in the weekly chart below, the last week ended in declines, in addition, a candle with a bearish wick was formed that tests both resistance at 83,32 and 20-week SMA providing an additional factor of confluence.
Considering the above, it may turn out that the course to the south will continue to dominate this week. The closest support for this scenario can be found around 81.50, and after overcoming this year’s lows, bears will open their way to another key level at 79.00.
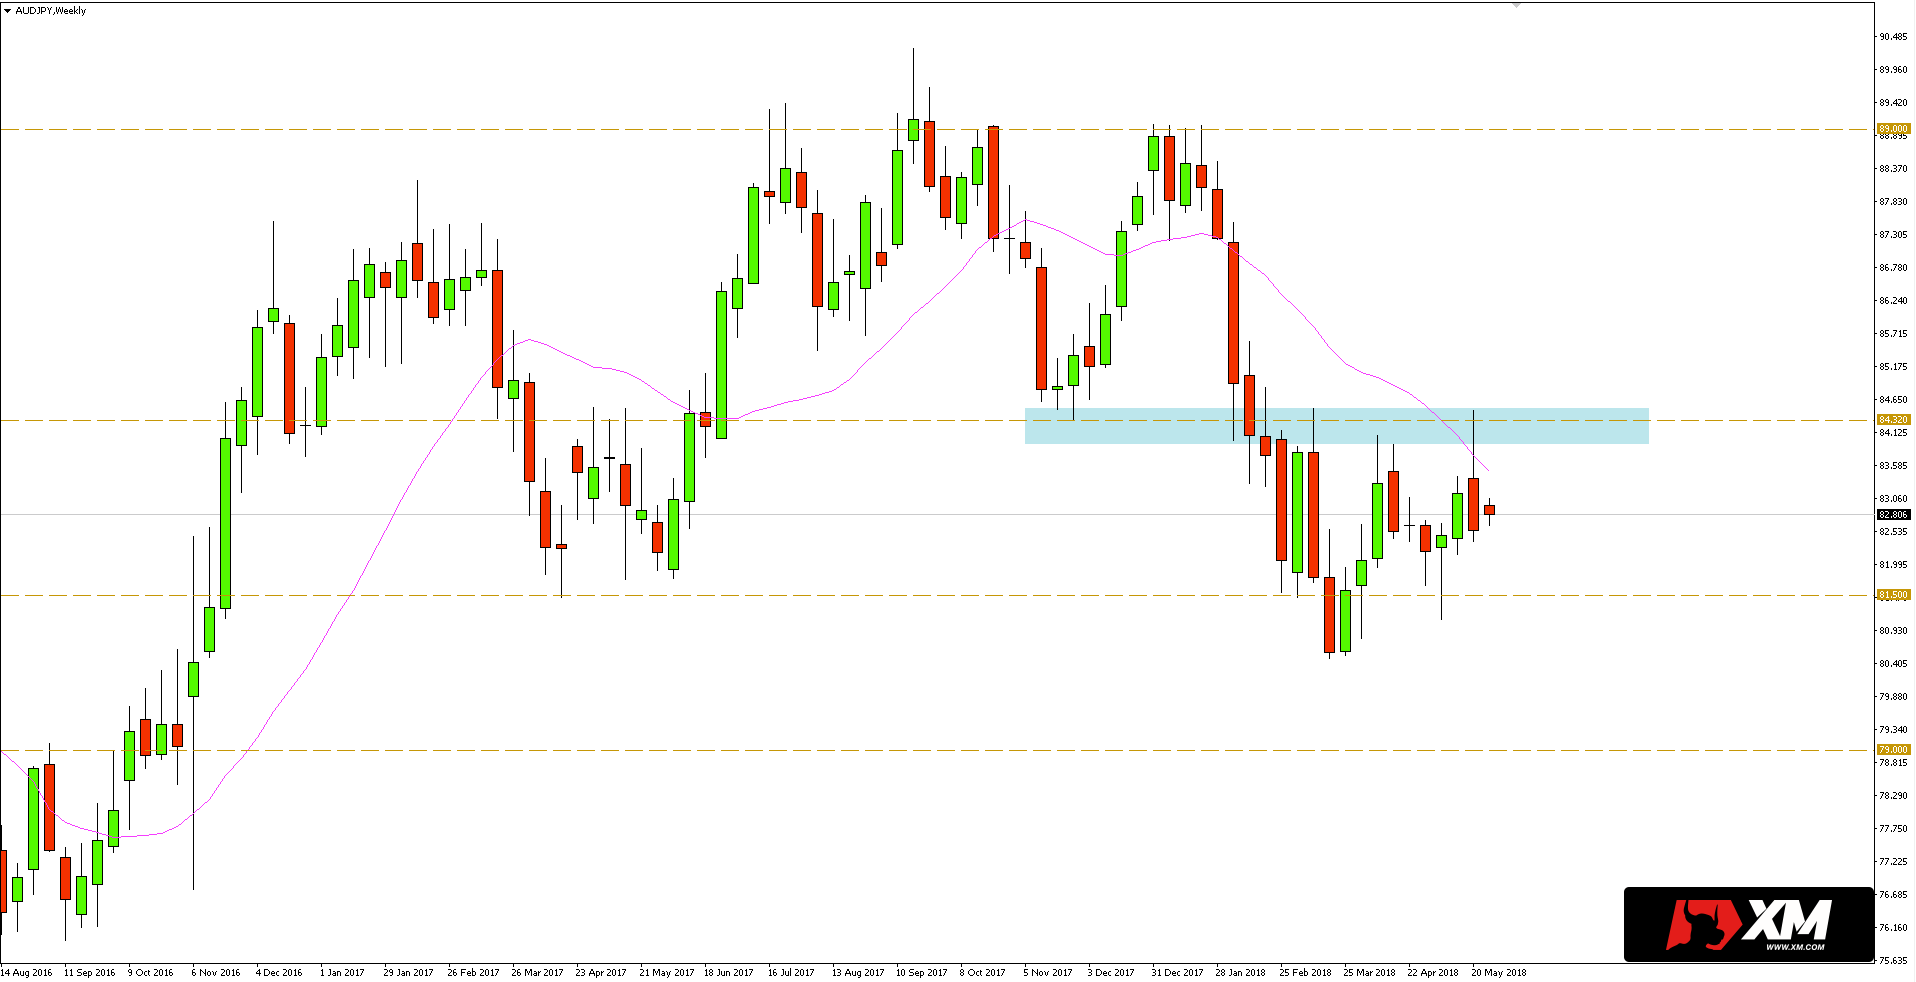
Alternatively, closing the week above the last high and successfully breaking the zone at 84.32 will provide a potential for a move towards 89.00, where are placed this year’s highs.


