The EURUSD pair, after a period of strong increases ending with a maximum of 1.2176 this year, has started a downward correction between the two lines forming the downward channel – in this case we can call it the ‘flag’.
- confluence of support at 1.2050
- on Thursday, ECB decisions on further monetary policy
- bearish divergence on the daily chart
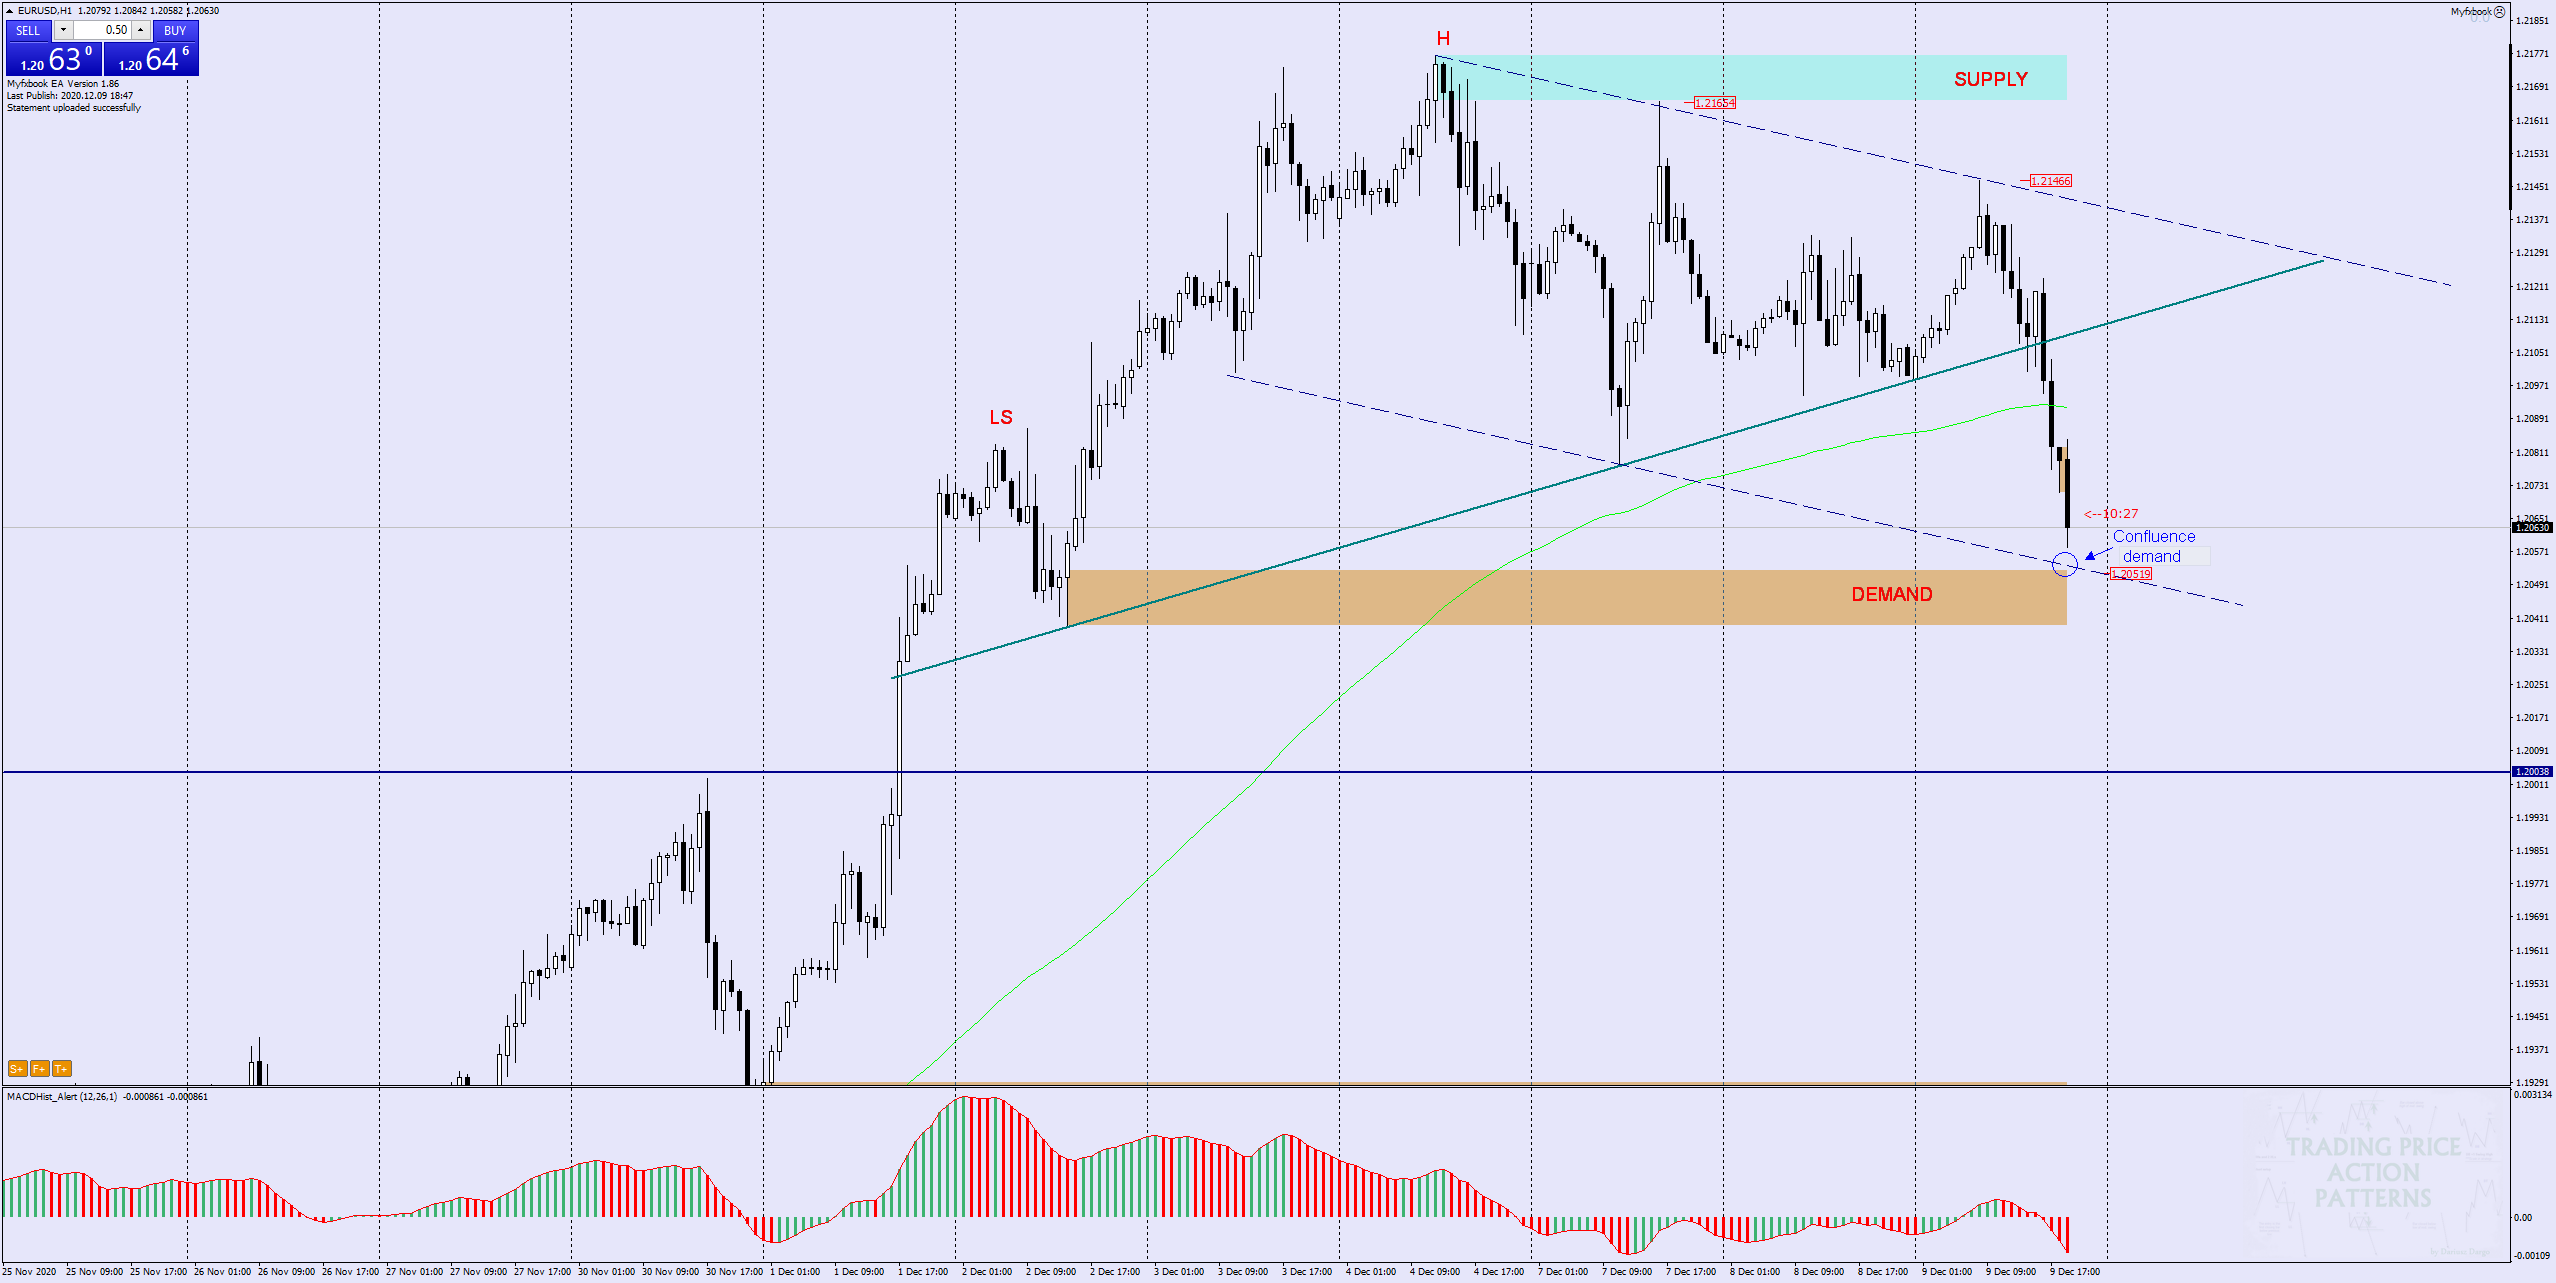
Today’s quotations, after initial increases, have turned into declines during the American session and the price is already very close to the support of the flag and the demand zone.
This intersection of the two levels is called confluence of support – on the graph it is marked by a blue circle.
Why is confluence so important?
The confluence of two factors indicates that the price response in this area (level) can be a turning point for the instrument and determine the direction for subsequent sessions. Overcoming such confluence usually results in an increased inflow of orders and increases the existing volatility and trading volume of a financial instrument.
On Thursday (10.12) we will find out what monetary policy the ECB – European Central Bank – intends to pursue. The decision on interest rates will be followed by a press conference of the head of the bank, Mrs Lagarde.
Decisions taken by central banks usually result in increased activity on the currencies concerned.
In the case of the analysed EURUSD pair, this may be an impulse to overcome the 1.2050 level or to strongly rebound and continue the upward trend on that pair. Additionally, the unclear situation around the EU-UK trade agreement increases the chances of high volatility in the coming hours.

If we look at the situation on the chart only from a technical point of view – the downward divergence that appeared today on the Daily chart would indicate a break of support and declines to the nearest S/R level as of 1.2000.
Undoubtedly, there is a lot of excitement ahead of us in the upcoming sessions, it is necessary to be modest and not to risk a large volume and to secure the orders well with stop loss.
I also recommend this stuff:
Trading with PA+MACD, or how to increase the probability of winning
ongoing analysis https://t.me/TradewithDargo
 In our Facebook group, which you can join anytime: https://www.facebook.com/groups/328412937935363/ you will find 5 simple strategies on which my trading is based. There, every day we post fresh analyses of currency pairs and commodities. You can also visit my channel where I post my trading ideas: https://t.me/TradewithDargo


 Review")


