A useful Technical Analysis tool
Definition
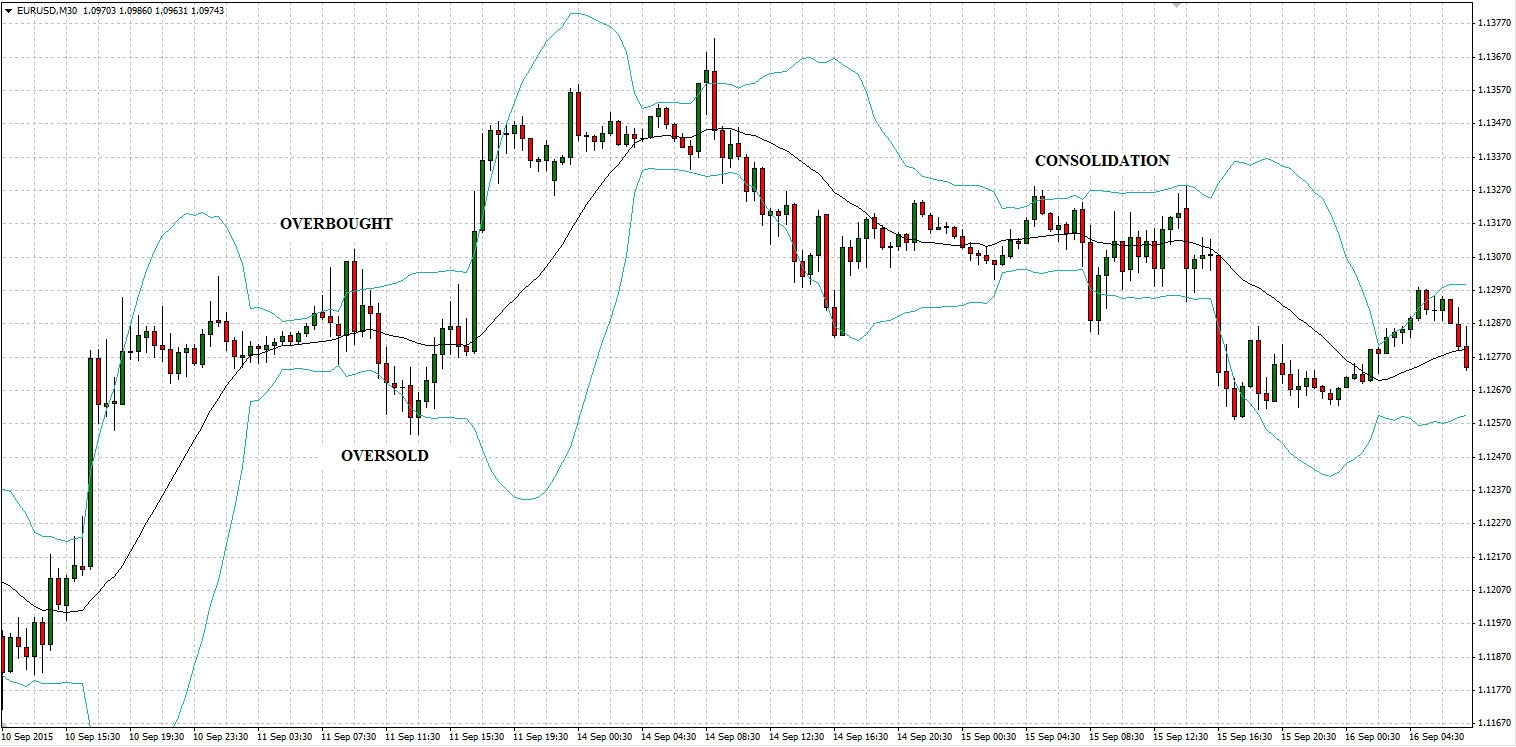
This indicator describes a price channel, the middle of which is is a simply moving average (SMA 21). The upper and lower lines of the Bollinger Band are created by adding for the upper band and subtracting for the lower band the value connected with price volatility. The price tends to move within this channel.
This tool was created by John Bollinger and copyrighted as recently as 2011. It differs from other indicators in as much as it is displayed directly on the pricing window as opposed to others like MACD and stochastics which are displayed below the pricing window.
Of course, this is not a single indicator on which to initiate a trade, it provides a verification of signal.
YOU CAN START TRADING ON FOREX MARKET USING FREE WINDSOR BROKERS ACCOUNT

Examples of using Bollinger’s Band in trading:
- During periods of high volatility, bollinger bands provide a head start before a period of low price volatility and vice versa.
- When the price breaks above the upper band it provides an overbought market and, subject to verification is a sell signal.
- When the price breaks below the lower band it means that market is oversold and it is buy signal.
- Additionally the bands provide support and resistance levels