Ichimoku Kinko Hyo is one of the oldest investment strategies created before World War 2 by Goichi Hosoda – Japanese journalist. This system since beginning of 70’s is used with effects by large group of investors over the world.
Ichimoku strategy is one of the trend follower strategies – with high level of probability you can say whether current moves are a trend or just a correction, setting exact moment of entering the market or leaving it. Ichimoku Kinko Hyo is commonly used by Forex market traders – however we want to show that this option is also great fro traders investing in binary options. Thanks to high effectiveness of signals, Ichimoku let us generate stable profits in longer time period.
OPEN YOUR OPTIONTRADE ACCOUNT RIGHT NOW AND GET ACCESS TO OPTIONS EXPIRATION RATE UP TO 85%!
Basic Ichimoku lines
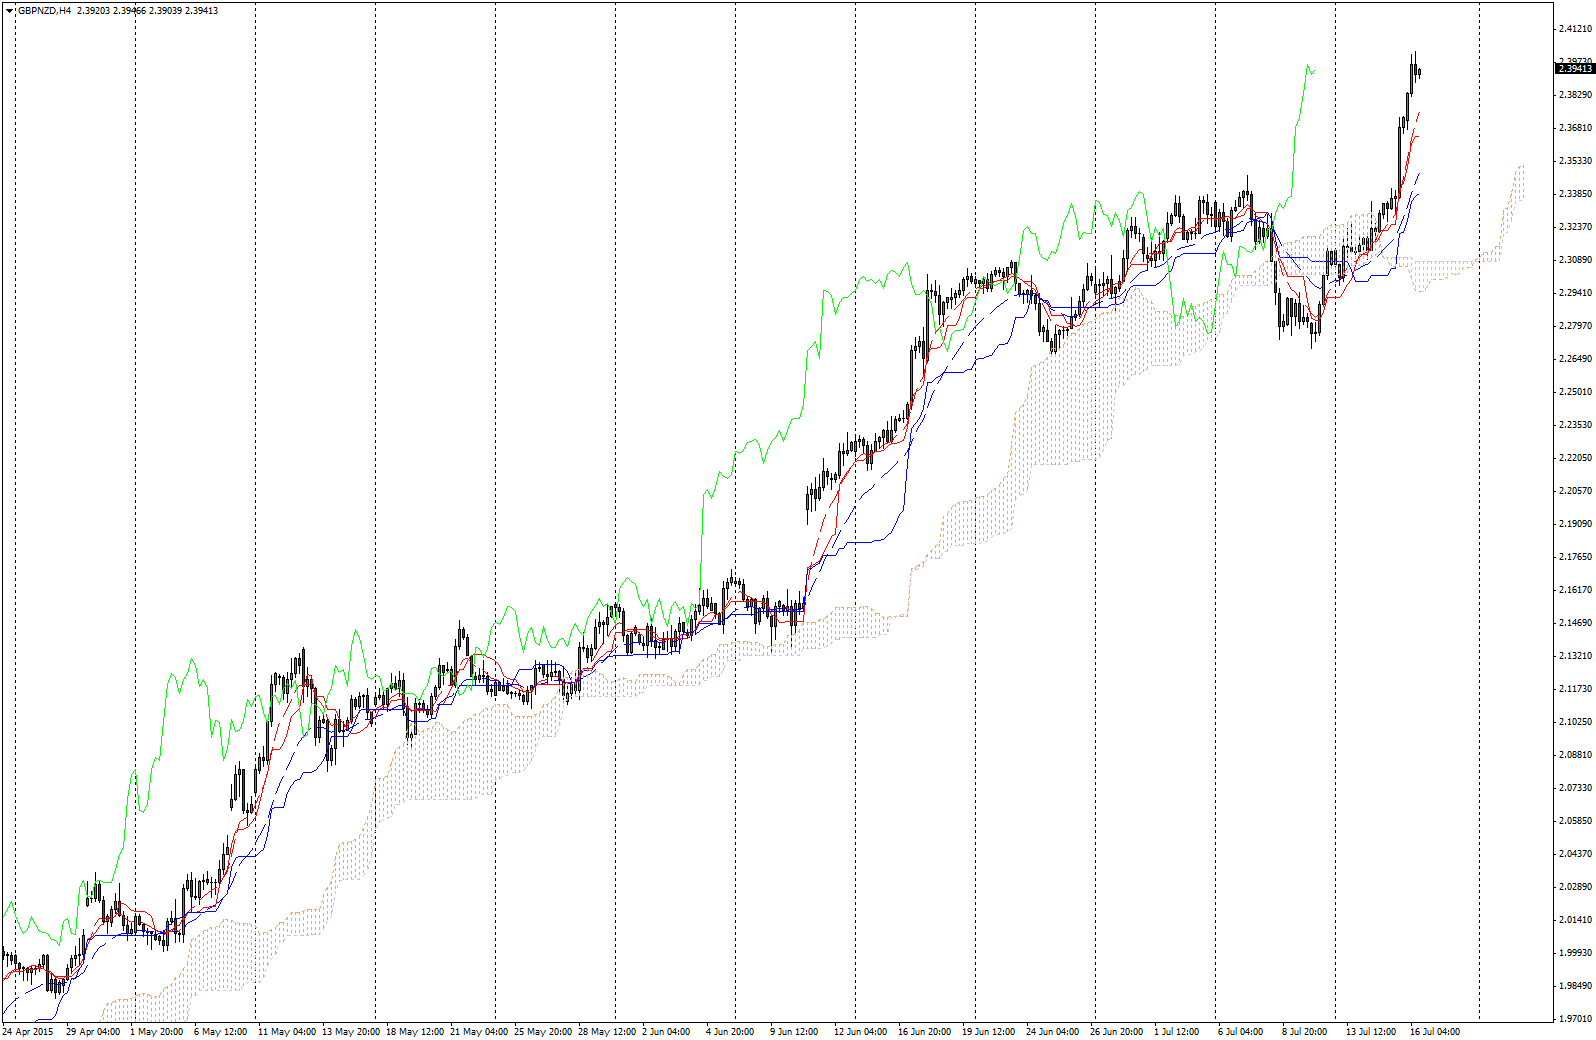
Before we go on, everyone interested in this strategy should download Ichimoku Comparic and BarTimer indicators. This is how standard Ichimoku offered by Meta Trader looks like:
This is how it looks like after installing the indicator:
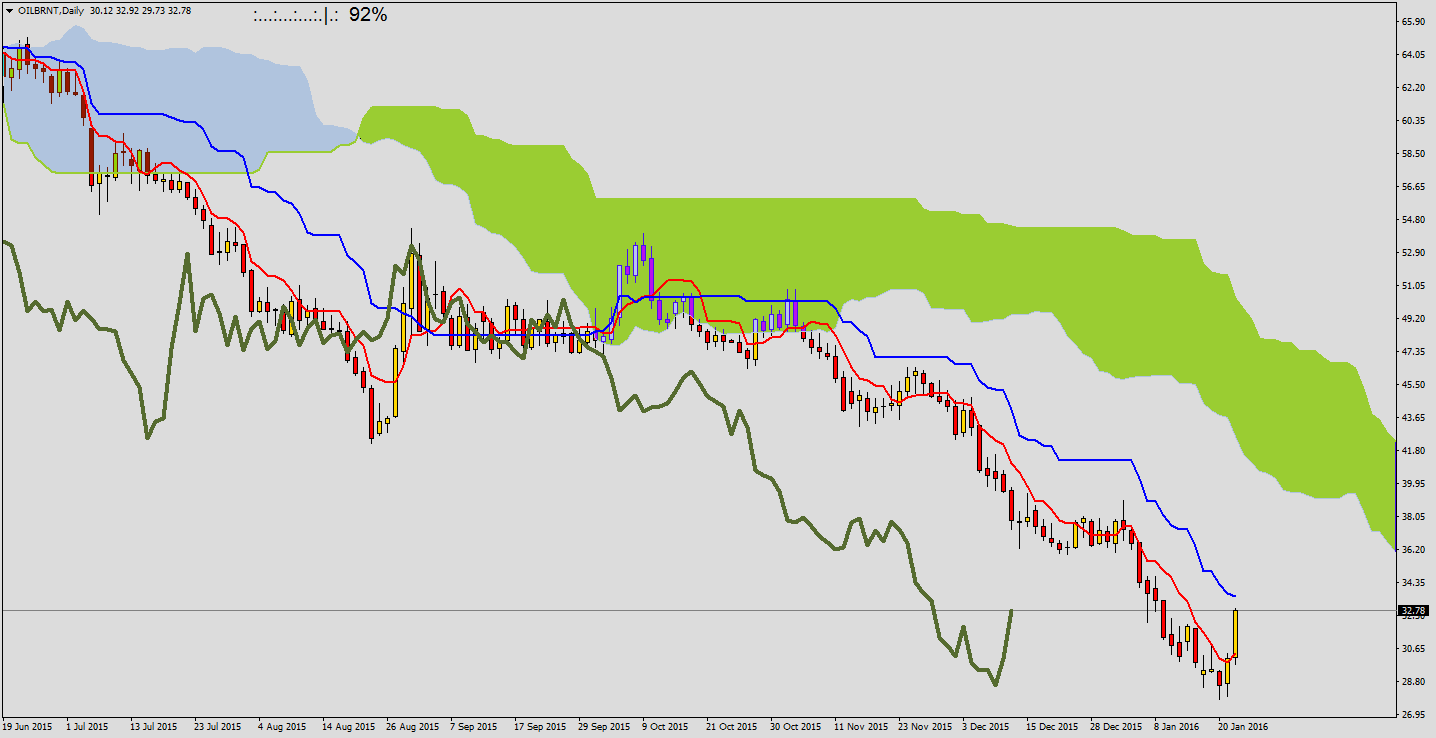
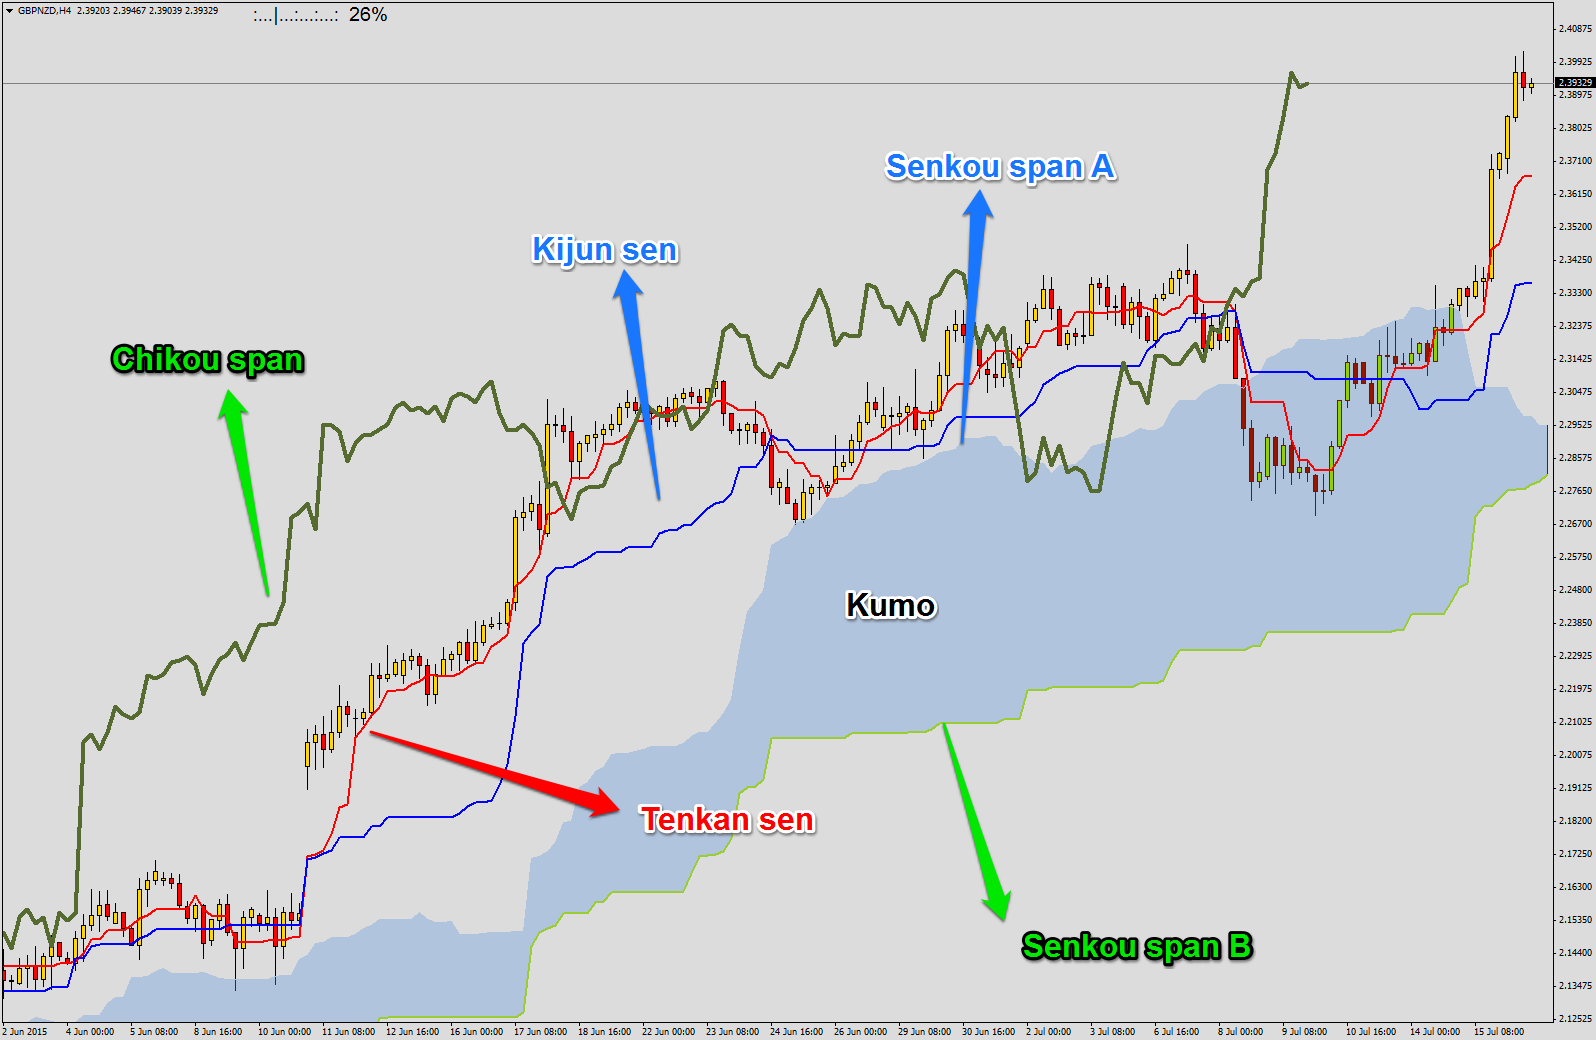
As you can see, transparency of the second one is much better, we can easily identify signals. Explanation of all Ichimoku lines with way to set it:
- Tenkan Sen – the red one. It is an average, which you have after getting mean of highest high and lowest low created by price in certain time – (HH+LL)/2 from last 9 periods. Tenkan Sen is usually close to the price so it is first support/resistance level.
- Kijun Sen – the blue one. Average of highest high and lowest low from last 26 periods. Kijun Sen is a line, on which strong corrections often end, stronger than Tenkan Sen.
- Chikou Span – the green one. It is line chart moved back by 26 periods and it is to confirm trend direction. If it is above price trend is bullish, if it is below trend is bearish.
- Senkou Span A – upper band of bullish (blue) cloud (Kumo) or lower band of bearish (green) one. It is the average of Kijun Sen and Tenkan Sen moved 26 periods ahead. Another Ichimoku feature – average is placed 26 bars ahead and we can observe how the price will behave in comparison to Senkou Span A in the future.
- Senkou Span B – lower band of bullish (blue) Kumo or upper band of bearish one (green). You will get Senkou Span B by having the average of highest high and highest low from last 52 periods and moving it 26 periods ahead.
- Kumo – area between Senkou Span A and Senkou Span B. Kumo cloud will have different colours – bullish blue or bearish green. When price is in cloud, then market is in consolidation – there is uncertainty among investors. Decisions are made in the moment when price is above or below Kumo or in the moment of breaking the cloud. Kumo is additional confirmation of the trend.
It can look really complicated, but it is simple to remember. Take a look at the chart:
Breaking Kumo
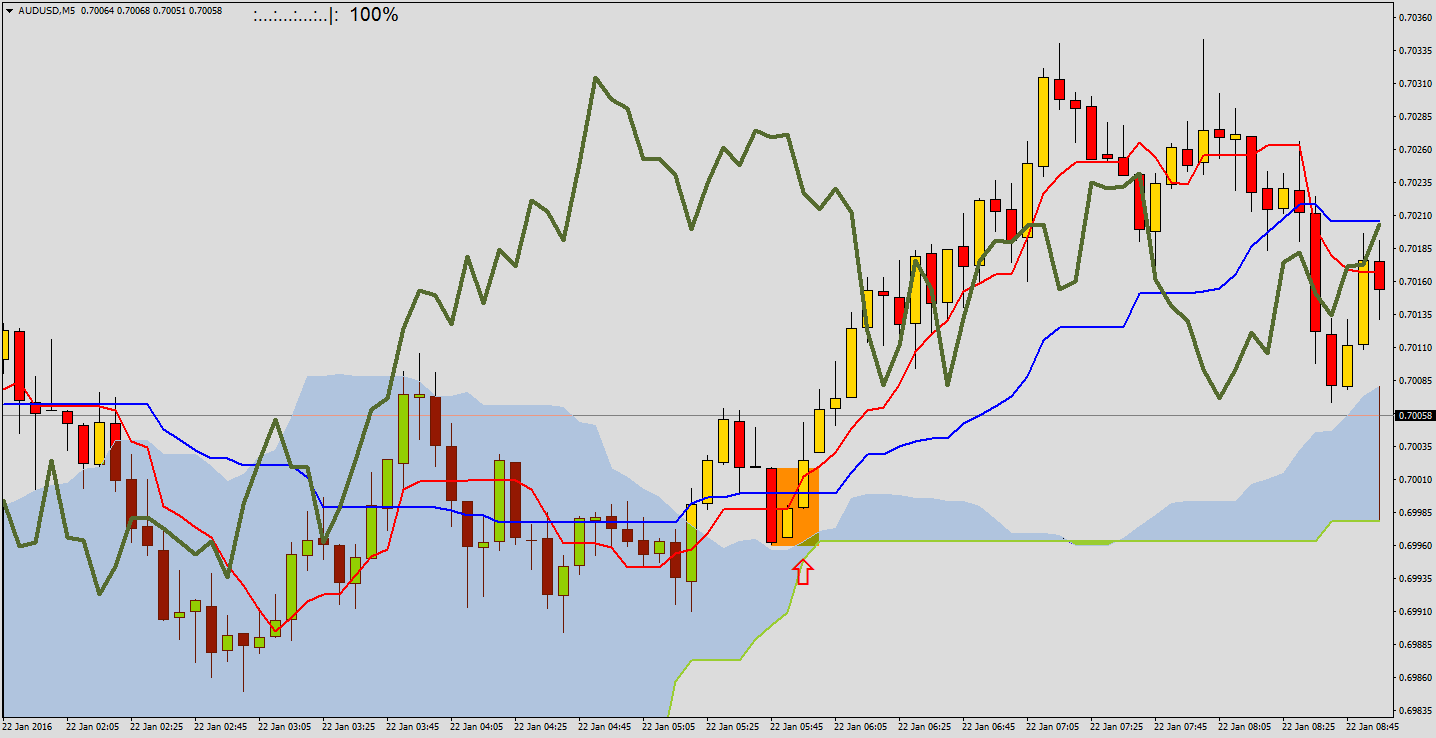
CALL signal – price is leaving top of cloud – when cloud is bullish (blue). More dynamic break – stronger signal.
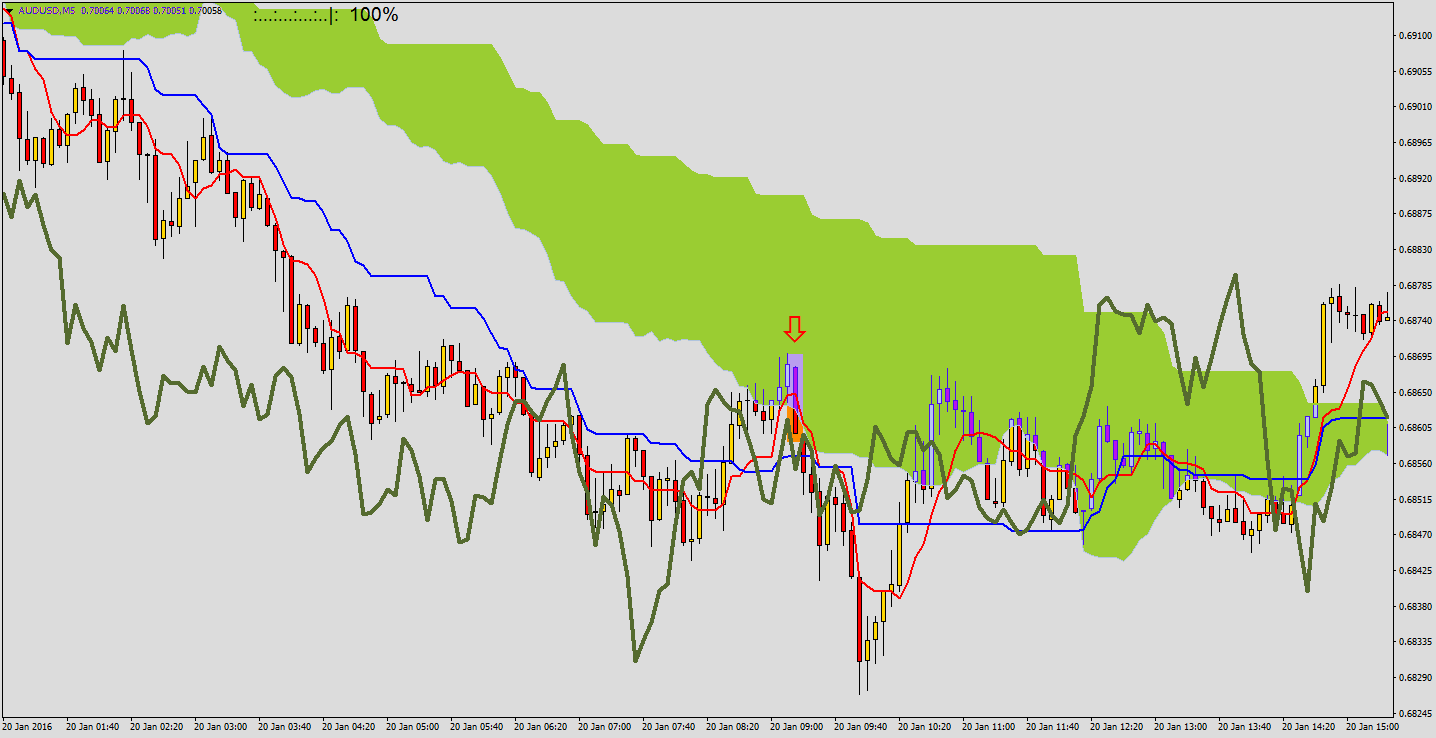
PUT signal – price is leaving low of the cloud – when cloud is bearish (green). More dynamic break – stronger signal.
Crossing of Tenkan Sen and Kijun Sen
More experienced or looking for better filter of signals traders should make up this strategy with crossing Tenkan Sen and Kijun Sen. In combination with breaking out of cloud and Chikou Span setting we can have really interesting effects and high level of effectiveness.
Signals generated by Kijun and Tenkan:
- Tenkan Sen is crossing Kijun Sen from below and it is below cloud – weak buy signal
- Tenkan Sen is crossing Kijun Sen from below and it is in the cloud – neutral buy signal
- Tenkan Sen is crossing Kijun Sen from below and it is above cloud – strong buy signal
- Tenkan Sen is crossing Kijun Sen from above and it is above cloud – weak sell signal
- Tenkan Sen is crossing Kijun Sen from above and it is in cloud – neutral sell signal
- Tenkan Sen is crossing Kijun Sen from above and it is below cloud – strong sell signal
To increase chance of ITM close of option, we should focus only on strong CALL and PUT signals. On the chart it looks like this:

Combining Ichimoku Binary signals altogether
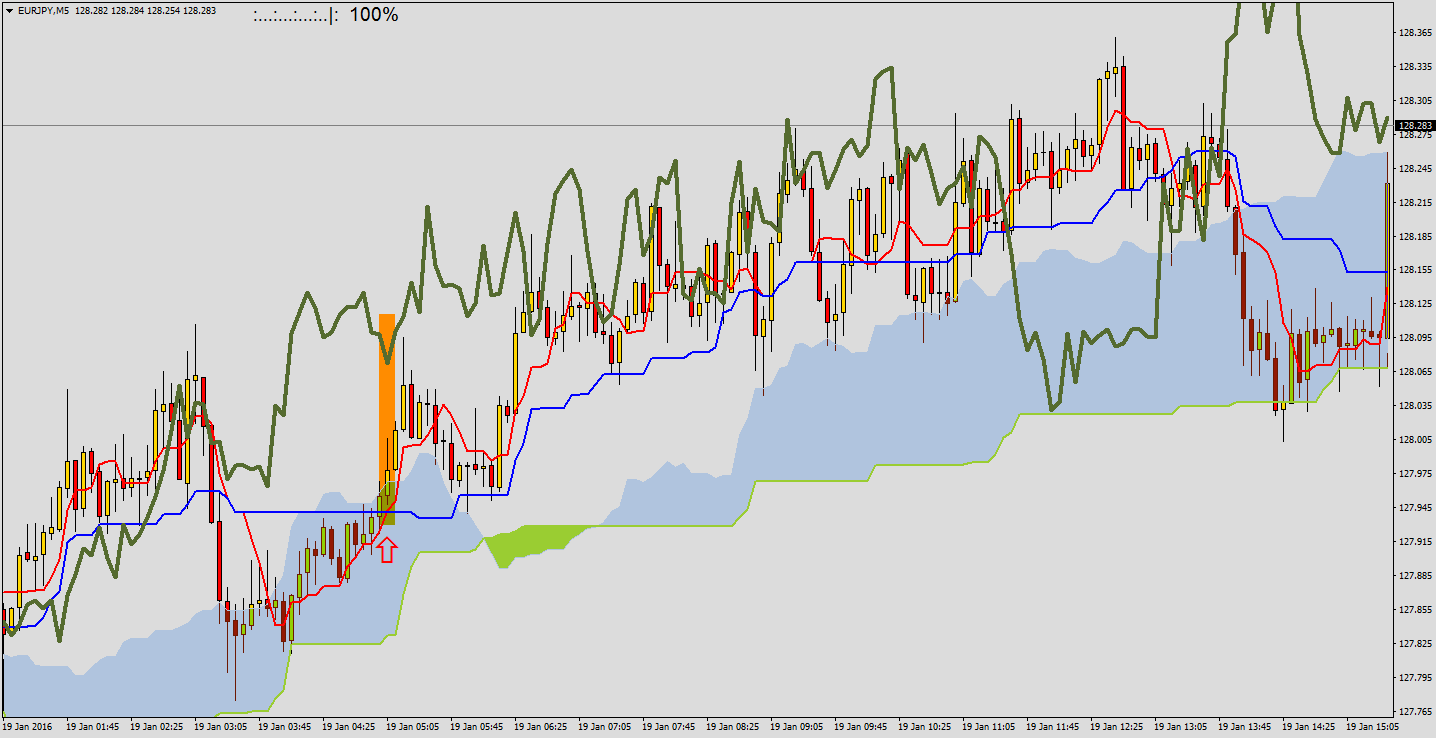
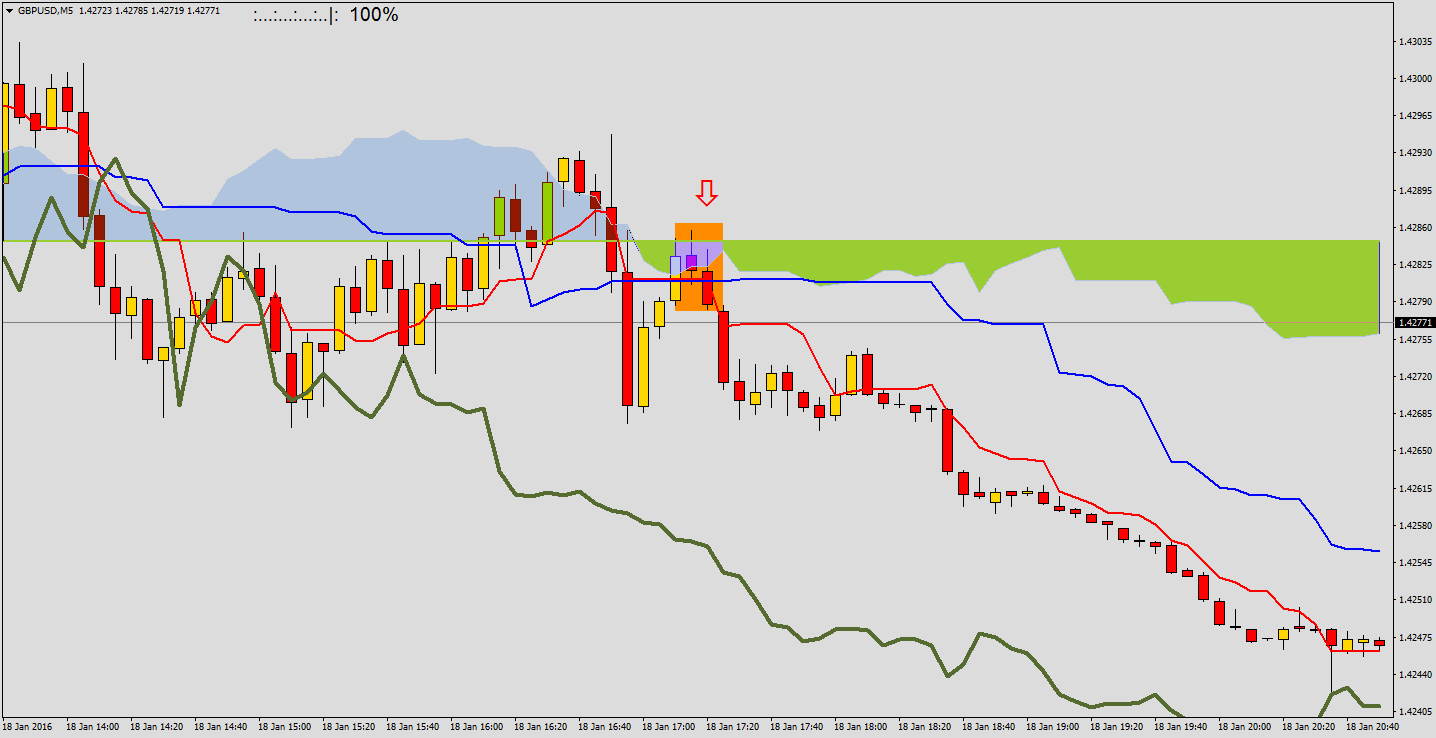
Connecting breaking from cloud with signals generated by Tenkan and Kijun will decrease number of opportunities to open position, but it will filtrate bad ones ending with OTM. Below you can see two charts with CALL and PUT signals after completing all Ichimoku requirements:
IMPORTANT! When we consider all Ichimoku setups together, we can also analyze situation where Kijun and Tenkan give neutral/weak signals. In case of some markets number of perfect signals can be really small.
Requirements for all Ichimoku Strategy versions:
- M5 chart analyze (or other time frame you want)
- Standard Ichimoku settings
- Options expiring at least half an hour or hour after signal candle – after break price can consolidate or test the cloud for a while, so it is safety issue
- Ichimoku is very popular in Japan, so it is worth to choose pair with yen (it is not strict rule though)
- It is worth to use trend lines and supports/resistances to better understand technical situation
- Break from opposite clouds are also signals, but weaker (e.g. bearish break from bullish cloud)
- Enter only after close of signal candle (on the next one)
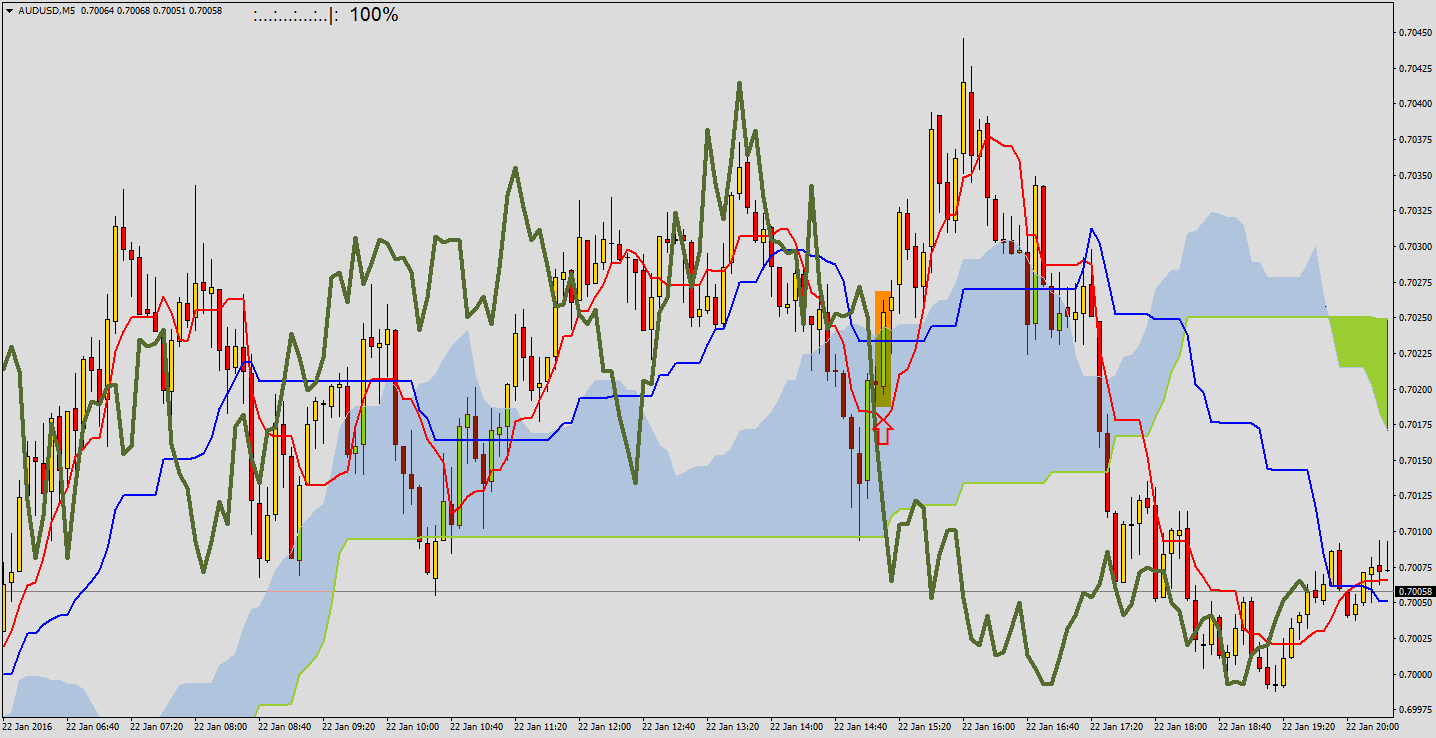
One more example of this strategy:
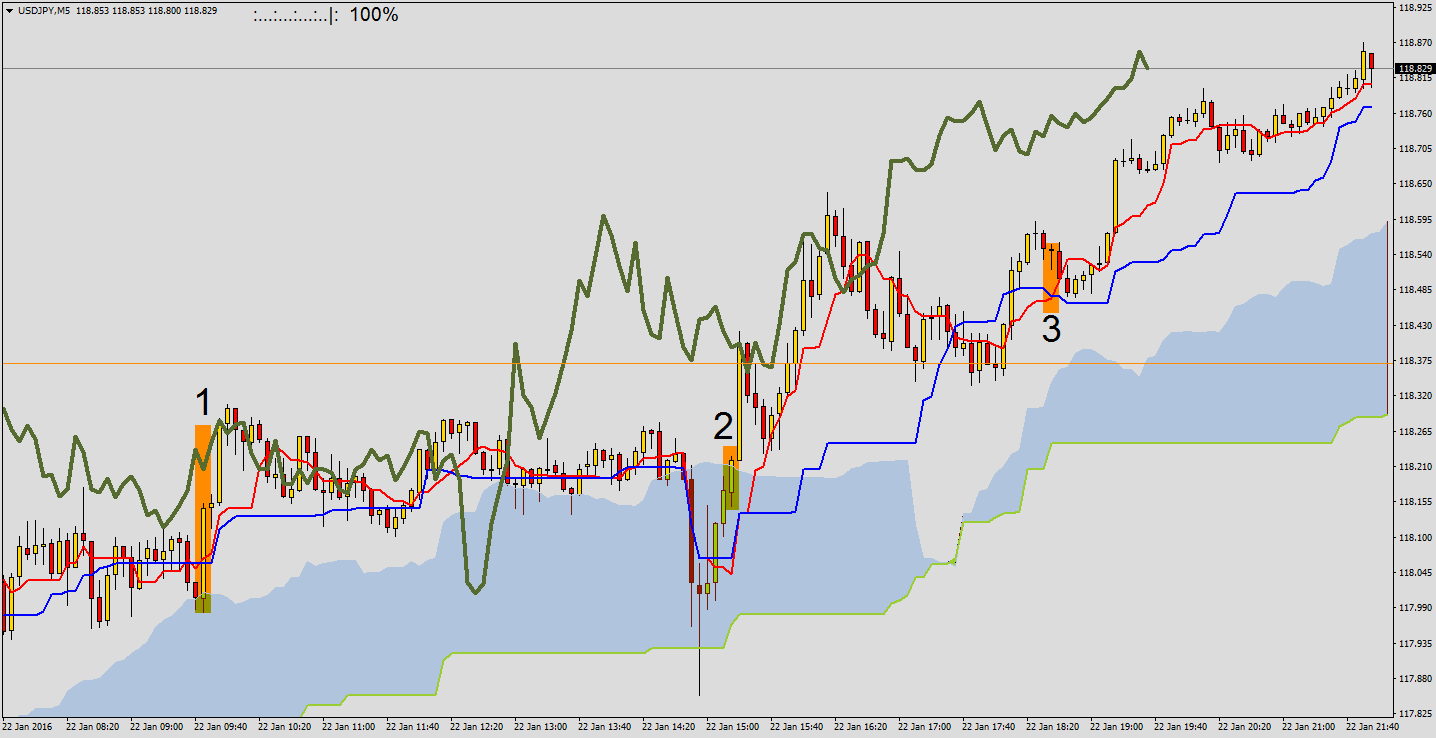
#1 – price is breaking above bullish cloud, Kijun crosses Tenkan from below, Chikou Span is above price (bullish trend) – a textbook example
#2 – just a break above bullish cloud (additionally Chikou Span is above price)
#3 – Tenkan crossing Kijun from below above bullish cloud


abundance of financial products – risk worth considering")


