Welcome to our Metatrader 4 (MT4) tutorial. MT4 is currently, by some distance the market leading trading platform available to retail FX traders.
Just about every broker has this platform, branded with their own loo, available to their clients. A number of competitors have been released, Metatrader have even released MT5 but it is MT4 that everyone gravitates towards.
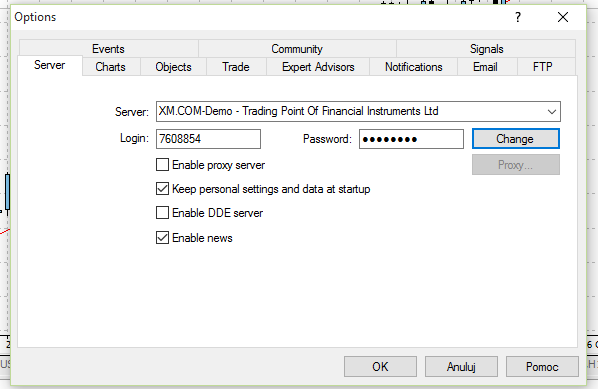
In most cases, to download MetaTrader you need to open account on the website of your chosen broker. Once that is done, you should get e-mail with your link to download page together with login and password details.
After downloading and installing platform you can open it and login on your trading account. You will be given a choice of two servers to open; either a demo or live account.
Having logged in and changed the password to your own, you can start to navigate around the site to gain some confidence. It is fairly straightforward. There are two sections: Your master password allows access to the whole site and provides full control. The investor password is for you to allow someone, possibly an investor, to view your trades.
Main screen
The first thing we see on our newly installed platform will be main screen containing charts, terminal and toolbar.
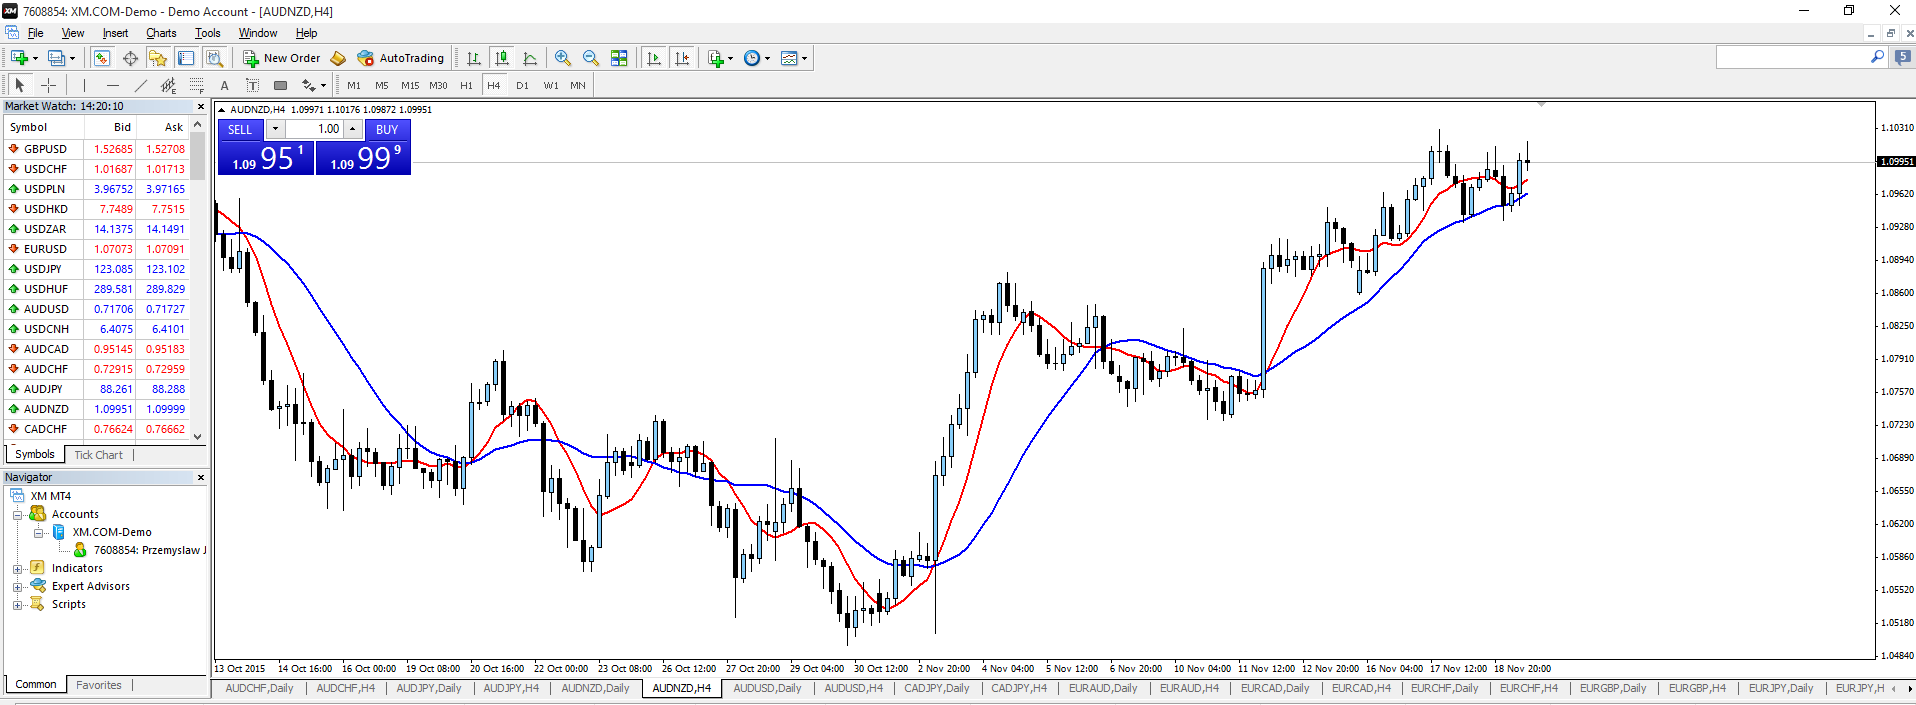
On the main screen we see most of the tools needed to begin trade.
Charts
Charts are the first thing we will see after opening platform.
This is a graphical representation of price and time. The chart shows the price of the asset at any given moment and the interval of the chart can vary the most popular are:
- M1 – One minute
- M5 – Five minute
- M30 – Thirty Minute
- H1 – One Hour
- H4 – Four Hour
- D1 – One Day
Price in exact moment can be only one, for example 1.50 USD for 1 GBP. But what if price during the day is in range between 1.50 and 1.51? Or what if the day started in 1.50 area, to the noon price rose to 1.51 and then fell to 1.48 ad ended day on 1.49?
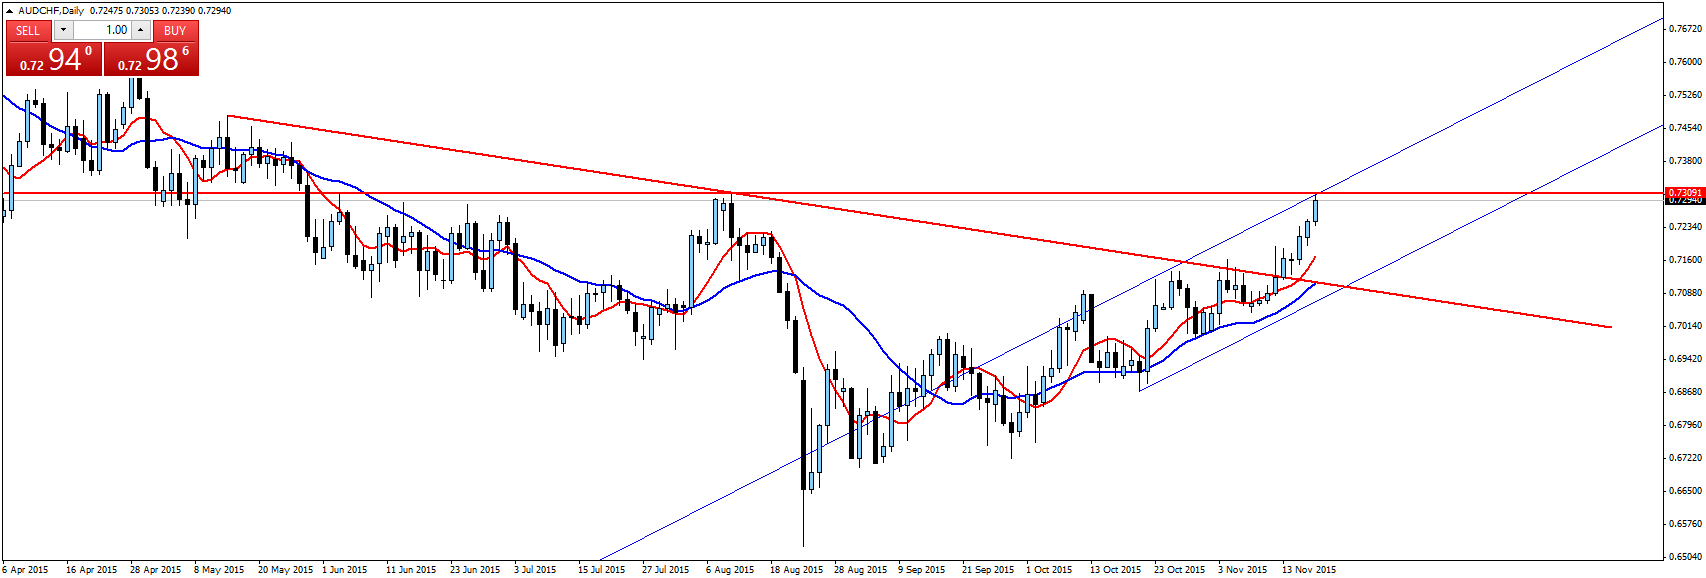
Then normal line chart showing only close price of time frame is not enough. We can use help of bar and candle charts, which show us 5 things:
- Time – each candle is responsible for some time frame, for example 1 minute, 1 hour, 1 day etc.
- Opening – price level in the moment of beginning of time frame
- High – the highest level price reached in this time frame
- Low – the lowest level price reached in this time frame
- Close – price level in the end of time frame.
This way candle is created, it has body – distance between opening and close, color- candles closing above opening have different color that these closing below, wicks – the set high and low of each candle. Most of candles have wicks but sometimes opening or close is at the same time high or low – in this case candle will not have one or even two wicks.
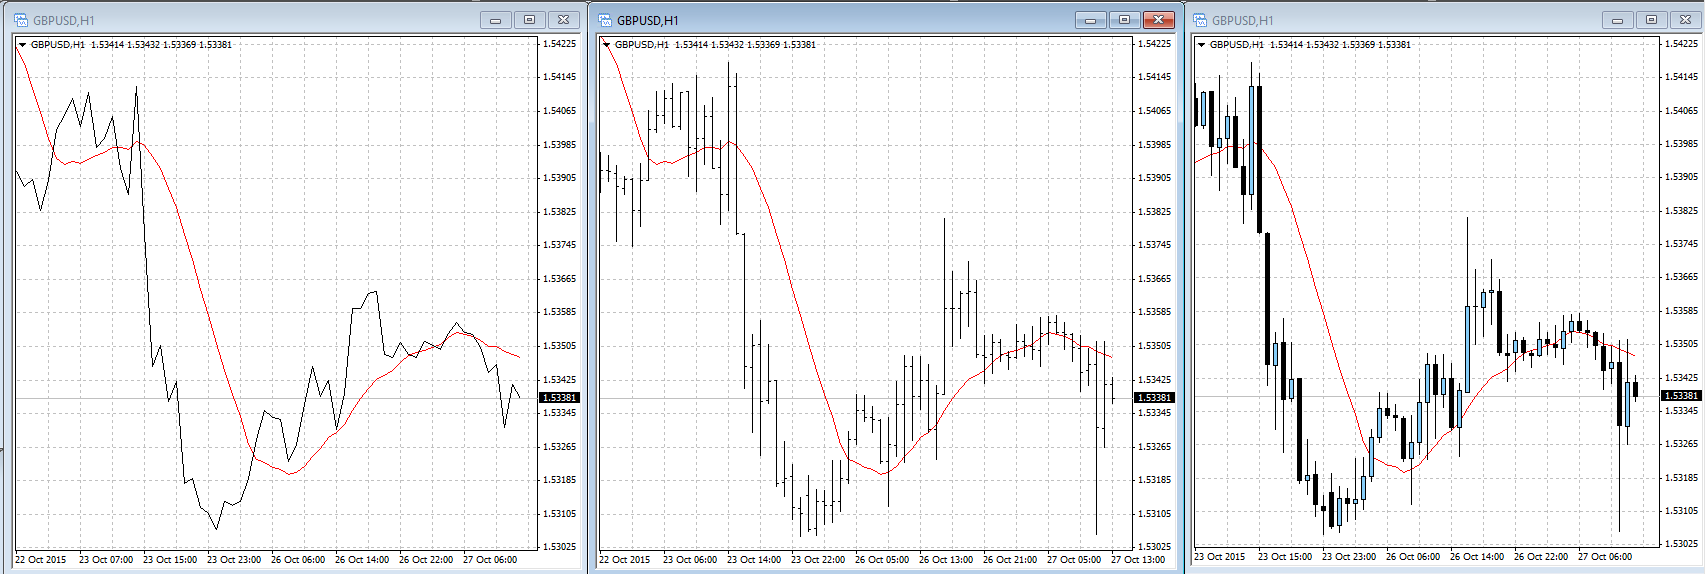
Each of these types have some pros and cons. Line chart is very simple to interpret, but it doesn’t have enough information trader needs. Bar and candle charts have the same information, but they look a little different. Bar charts better show “price swings”, waves, top and bottom patterns. Candle charts let you analyze better openings and closings setups. Thanks to that bar charts are theoretically more clear but candle charts let you easier use candle patterns.
If you ask which chart type is better, I will not answer. In my opinion every type is useful sometimes. For example banks often use charts with small zoom which reminds line charts.
Many traders us candle charts, especially these using Price Action in trading.
Platform windows
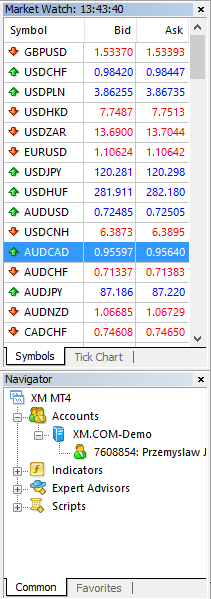
To important windows we should take a look at, are “Navigator” and “Market Watch”. The first one have references to our accounts which we saved during our login in the platform. Thanks to that we can easily switch between our accounts if we have more than one.
“Market Watch” let us follow all instruments available in our broker. Here we can easily open chart of any instrument we want.
If we cannot find some instrument which should be in broker offer, we should right click in the area of this window and click option “Show all”. Thanks to that list of instruments should be refreshed.
The other window we will need is terminal. There we will find opened positions or pending orders. Each order have a bunch of parameters.
![]()
![]()
Order – each order has its individual number and thanks to that it can be identified in history and broker’s database.
Time – the moment of opening position according to platform’s time.
Type – type of order, for example buy limit or sell stop
Size – how big is this position in lots.
Symbol – name of instrument.
Price – price at which transaction was opened. According to this price we will calculate our profit or loss.
S/L – Stop Loss order. This order is pending order in contrary to opened transaction in which it is closed.
T/P – take Profit order. It is similar to Stop Loss, just this type of order let us close transaction when price will reach the level we wanted and earn profit.
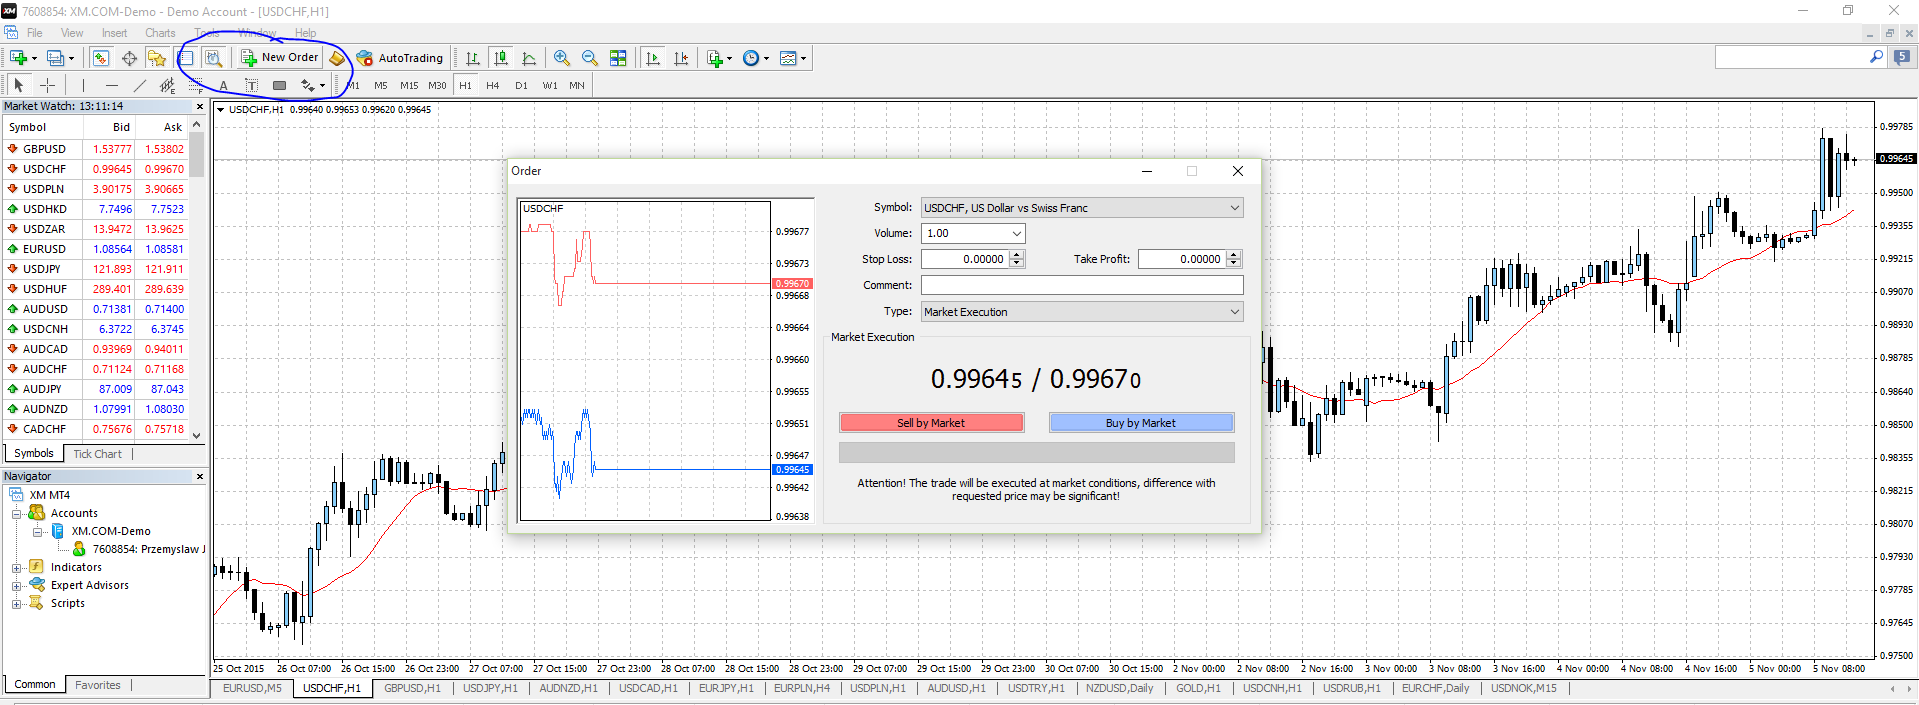
Opening transaction
When we already have account with some deposit, we will choose instrument and set size and transaction direction, we select option “New Order” on top of the screen. Then, in the order window we choose instrument (if it will be different than on the chart), size of transaction and buy or sell with bid or ask prices.
One Click Trading
We can also open new order with other possibility. We can click ALT+T or right click on the chart and choose “One Click Trading”.
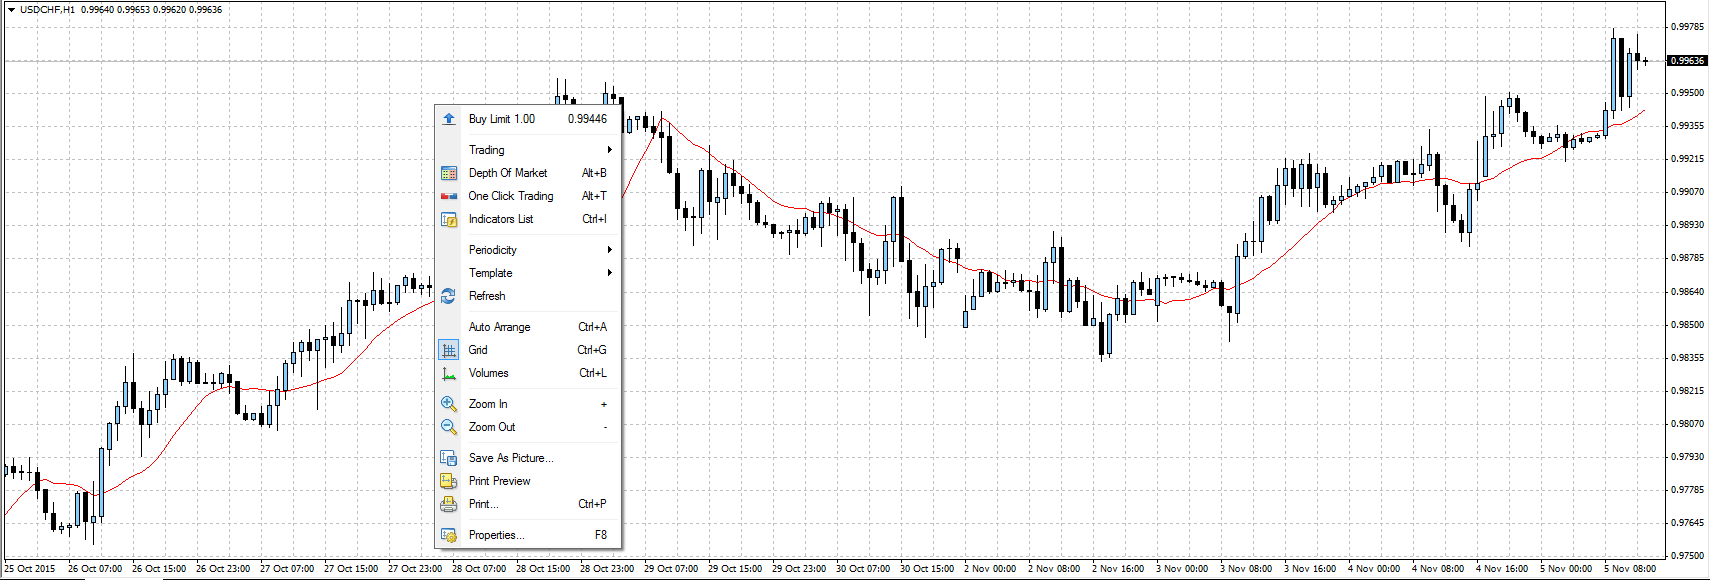
OCT let us set order with just one click. On the top left corner we have OCT panel with size, price bid/ask and buttons “buy” and “sell”. What’s more, using right click on the chart we will see options “limit” and “stop” with price we clicked on the screen.
It is very interesting tool to quick opening transactions and editing its parameters directly on the chart.
Chart properties
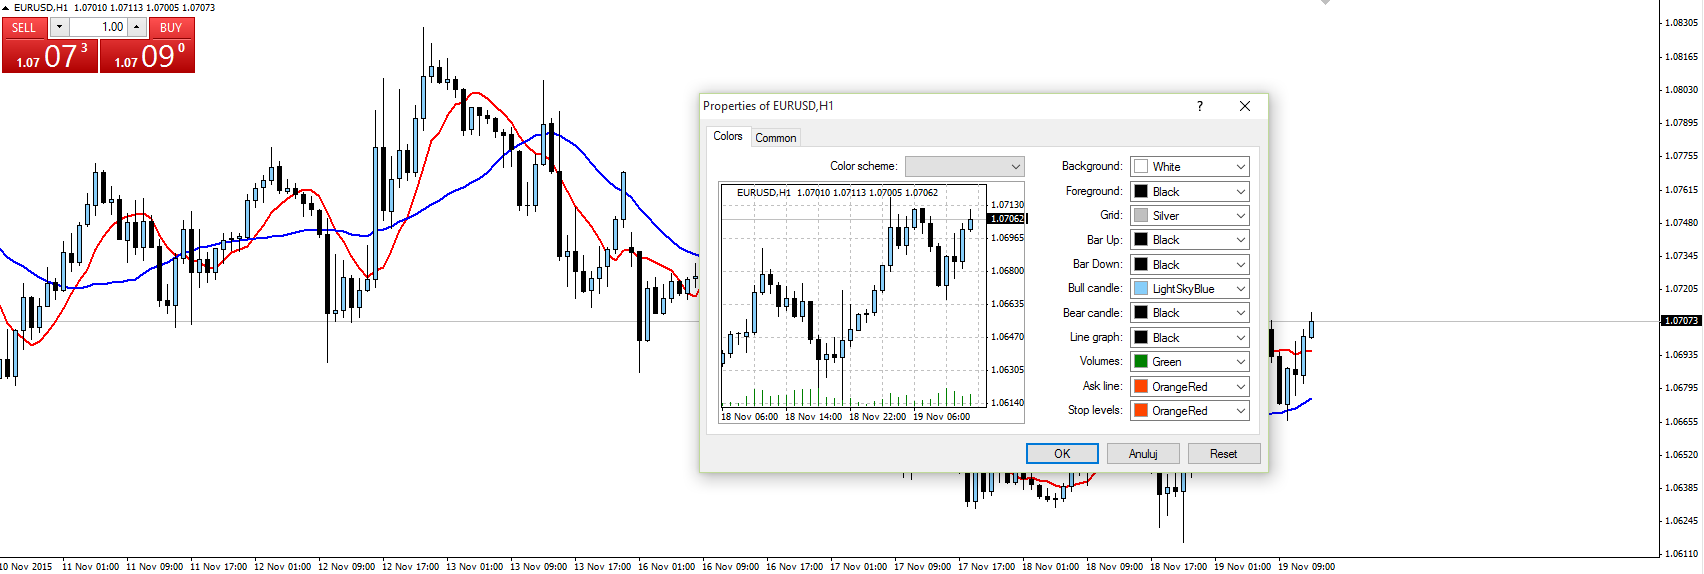
You can (and should) modify the chart so it will be well fitted to your preferences. MT4 let you change colors of elements seen on the screen, you can use prepared templates or create your own one.
In the General tab you can find basic settings of the screen, like showing bid/ask price, grid, volume, etc.
Plotting
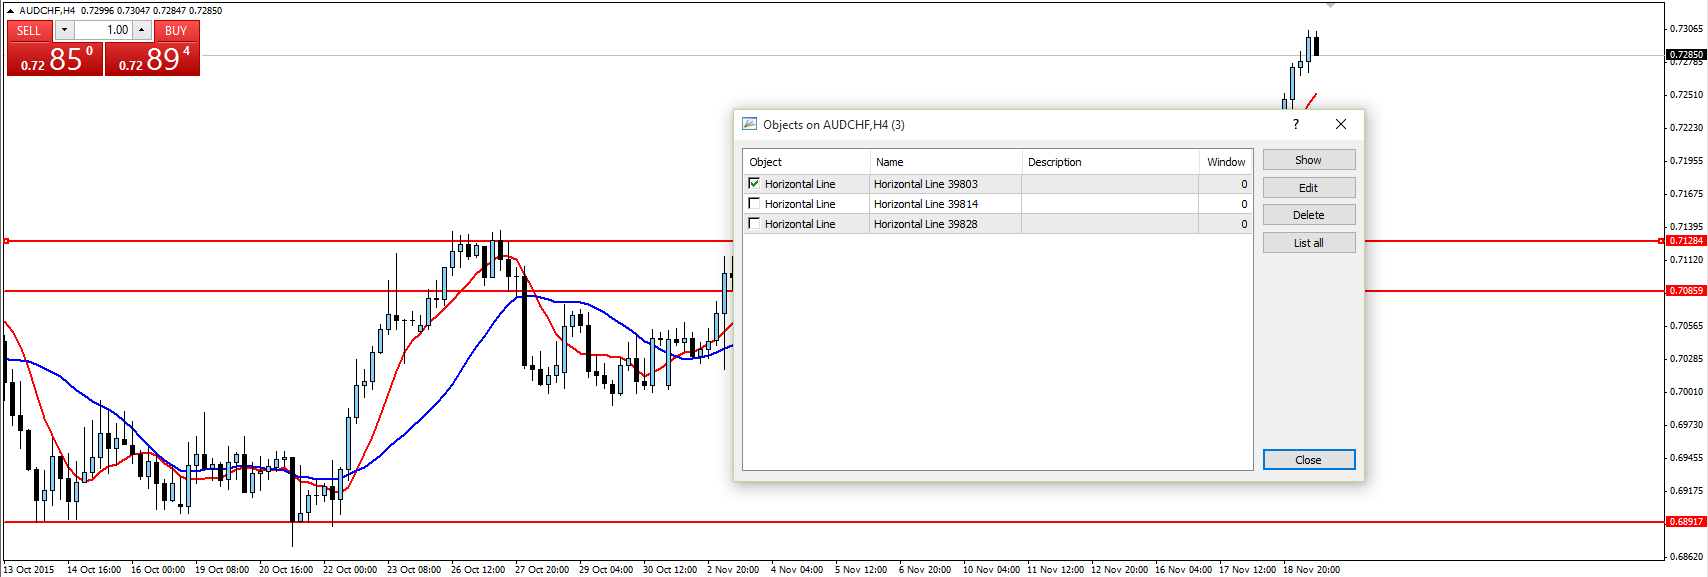
MT4 platform offers a lot of basic plotting tools useful in technical analysis. On the toolbar we can find just few of them, more are hidden in “Insert” tab. If you want to draw line or shape on the chart we have to set one or two points where our drawing will be set. Diagonal line will need two points showing two levels in some time. Equidistant channel will need three points ( two for trend line and one for equidistant line), similar situation is with triangle pattern.
Elements of our drawings we can mark, move and edit. To mark object we have to double-click it. Then we right-click it to see the menu. There we can choose operation we can do on this element and then open properties window where we can edit parameters.

In the properties window we can change e.g. color, style and thickness of line.
In “Parameters” tab we can set we can set number values of levels and time (X and Y axis) of particular points and if our trend line has to have two bands or just one.
”Visualiation” tab let us set on which time frames we will see our line. It is very useful when we use both small time frames and high ones because trend line on M1 or M5 TF will be useless on H4 or D1 chart.
When we right-click on the chart we can find option “objects”. There we can find list of all objects on the screen, it is easy way to edit each of them.
Indicators
Last tools we will write about in this tutorial are indicators.
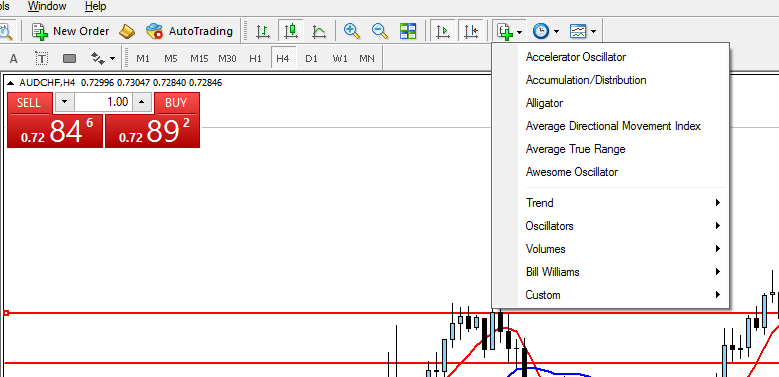
Indicators are usually derivative of the price, which is somehow transformed. They can smooth price movements in short time, or show dynamic or range of moves. The basic example is average. It let us show price mean from n periods, as price we can assume many things – close, opening, top, bottom, median etc.
In the example above we can see two averages on the chart with 8 and 21 periods. They have different values what is useful in different strategies. Averages can be used in looking for trends and consolidations and many other ways.


