BTC/USD – Bitcoin to US dollar – still moves under the downtrend. Just like last week, the price cannot cope with the 400USD level and the weekly chart shows a declines continuation pattern.
TRADE BTC OPTIONS THANKS TO TOPOPTION
For the technical analysis I use primarily:
- Trend lines
- Resistance and support levels
- Classic TA basic formations (triangles, wedges, flags)
- Basic Price Action patterns (pin bar, inside bar, outside bar)
- Fibonacci retracement to determine potential support and resistance levels
BTC/USD W1
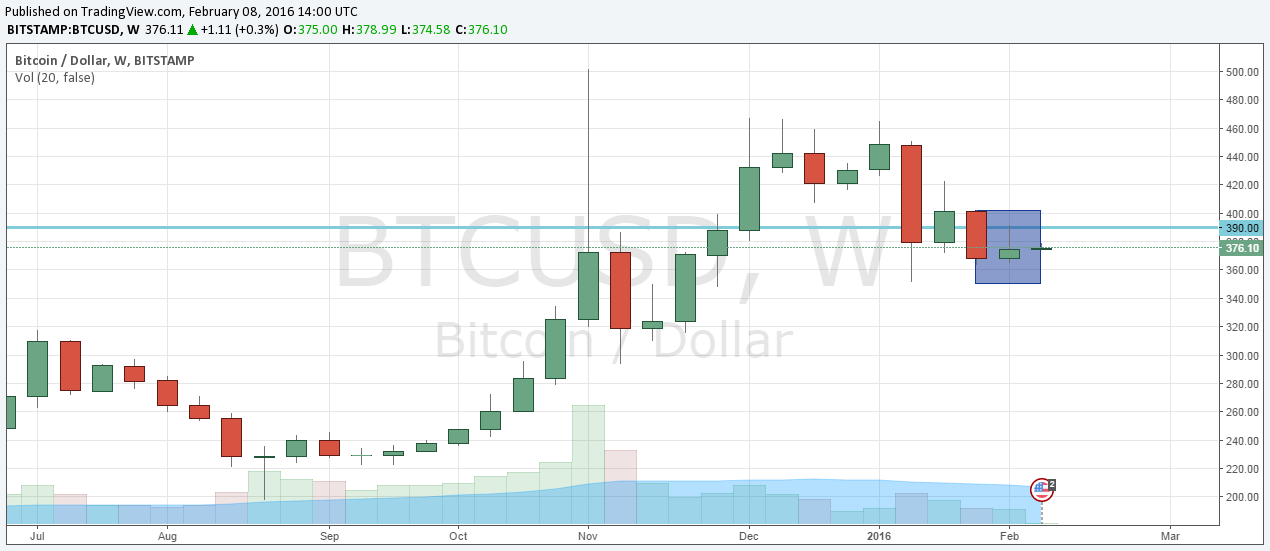
Previous week closed in the form of supply pin bar, just below resistance zone 390-400, which blocked stronger increases in November last year. Investors should look for selling opportunities in this area on the lower TFs.
BTC/USD D1
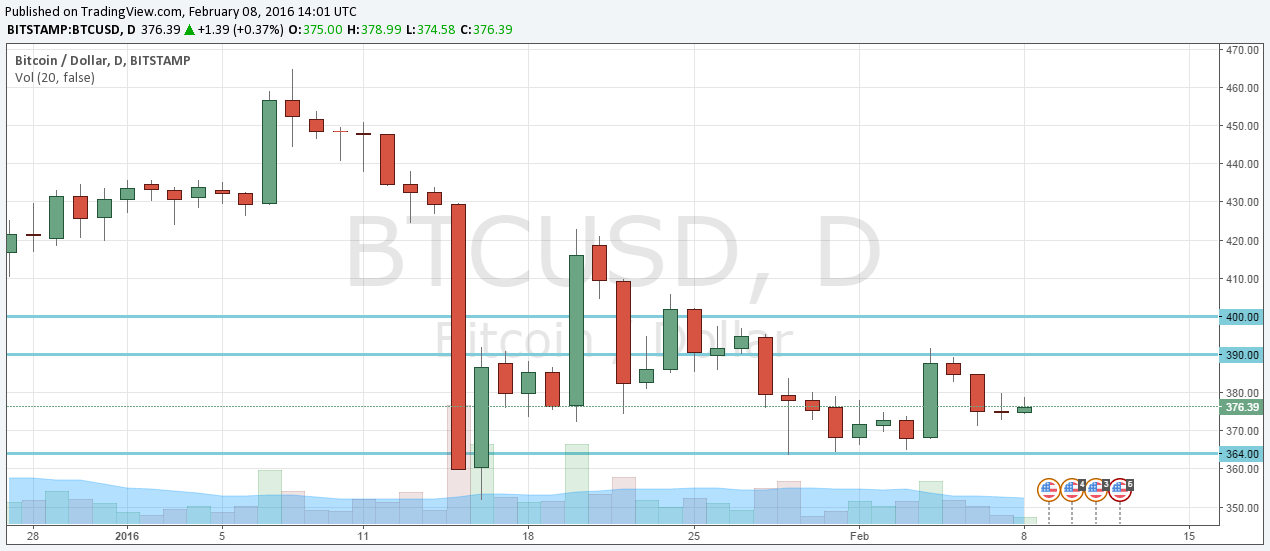
On the daily chart we can see that from the year beginning Bitcoin draws LH (lower highs). Since the beginning of February price repeatedly tested 364.00 low and tried to move above 390.00. The approached failed and currently price is blocked by above mentioned two horizontal levels.
BTC/USD H4
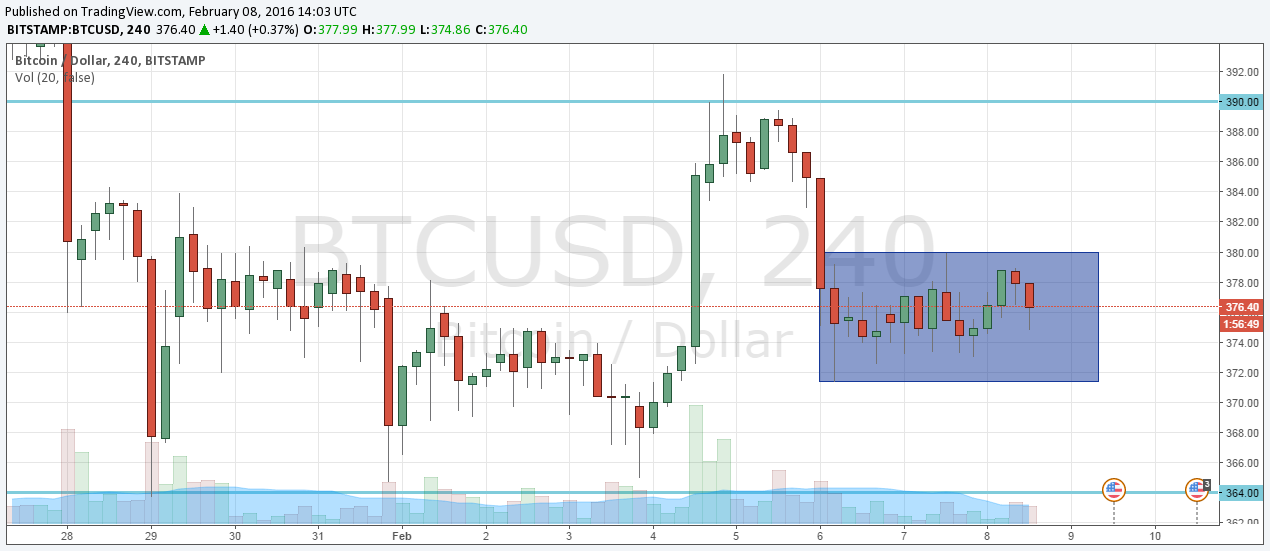
Intraday chart assures us that Bitcoin is currently in the middle of the trading range. In the last week price repeatedly accumulated above or below the current price (around 376.00). Breaking the blue rectangle will give a hint which site of the consolidation will be tested.


: Structure and Governance By Specialist Hay Nakash")


