USDJPY reached its maximum of 114.50 in October 2018. After several unsuccessful attempts to establish a higher peak, since mid-December of last year violent falls began, ending with a spectacular flash crash in the night of January 2/3, when, at a time of low liquidity and closed markets in Tokyo, the price fell sharply to 104.70. Since that memorable night, the price of the pair has been rising and moving in the growth channel.
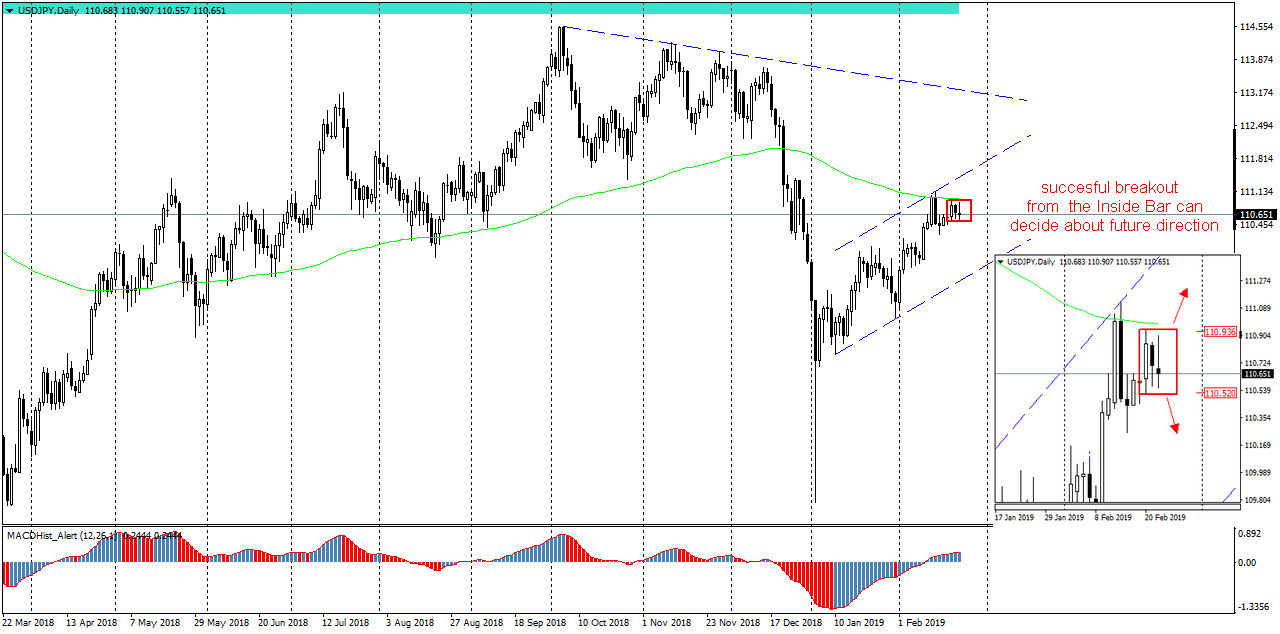
On the daily chart, we can see that the candle from 20.02 contains quotations from subsequent sessions creating Inside Bar formation. According to the PA+MACD strategy, if the breakout from the Inside Bar is accompanied by the appearance of the maximum on the MACD histogram and the oscillator starts to decrease – we can expect drops. Therefore, it is worthwhile to follow the quotations of this pair and join after the confirmed overcoming of the lower IB limit at the level of 110.50.
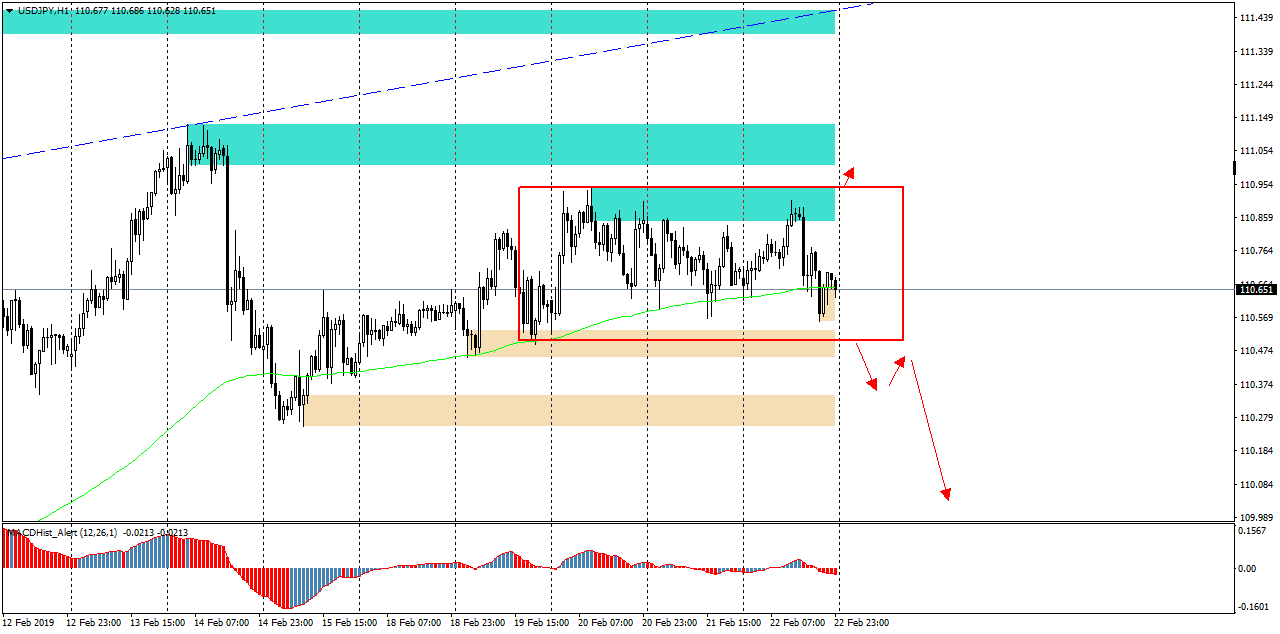
Looking at the H1 chart, we can see that the supply (blue) and demand (brown) zones are quite close to each other, which, once defeated, can cause more volatility. Mondays are usually “boring”, so perhaps only Tuesday will be a breakthrough for determining the direction of this pair for the upcoming sessions.


 Review")


