 Presented for binary options strategy uses two indicators. The first is the exponential moving average (EMA), and the other is the CCI (Commodity Channel Index). EMA serves us to determine the trend, and CCI in its unusual form, giving signals at the time the divergence between its indications, and keeping the price of a financial instrument. Analysis make the 15 minutes charts, and the expiry time for the strategy is in the range of from 15 to 30 minutes, so it should be suitable for traders who prefer low intervals.
[pullquote align=”full” cite=”” link=”” color=”” class=”” size=””]The described strategy you can try out the account with a broker – Option Trade, which is recommended by the portal Comparic.com.[/pullquote]
Prepare chart
What will we need?
- 15-minutes chart (M15) selected currency pair
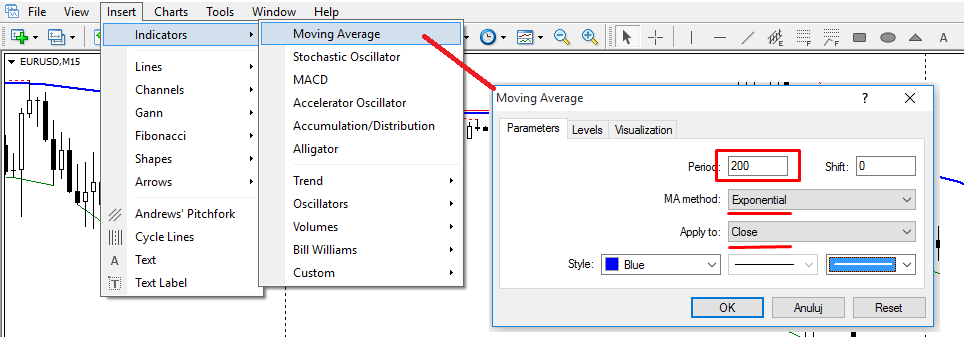
- Exponential Moving Average of 200 periods (EMA 200)
- CCI_Divergence indicator available for download by clicking the LINK
Adding exponential moving average is really a simple procedure for the MT4 platform, which is shown in the screenshot below:
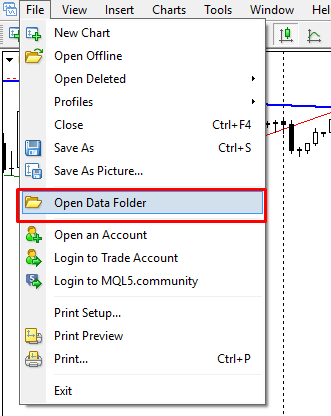
The second indicator of what we will need is CCI_Divergence. It is not by default built into the platform, it must therefore be downloaded from this LINK and put in a folder Indicators, which is located in the MQL4 our platform. Finding this folder enables the “Open Data Folder” shown in the picture below:
Once this is done, restart the platform and apply the indicator on the chart. As in the case of the EMA, here too, first click Insert -> Indicators -> Custom -> CCI_Divergence. We leave the setting unchanged and they should look like this: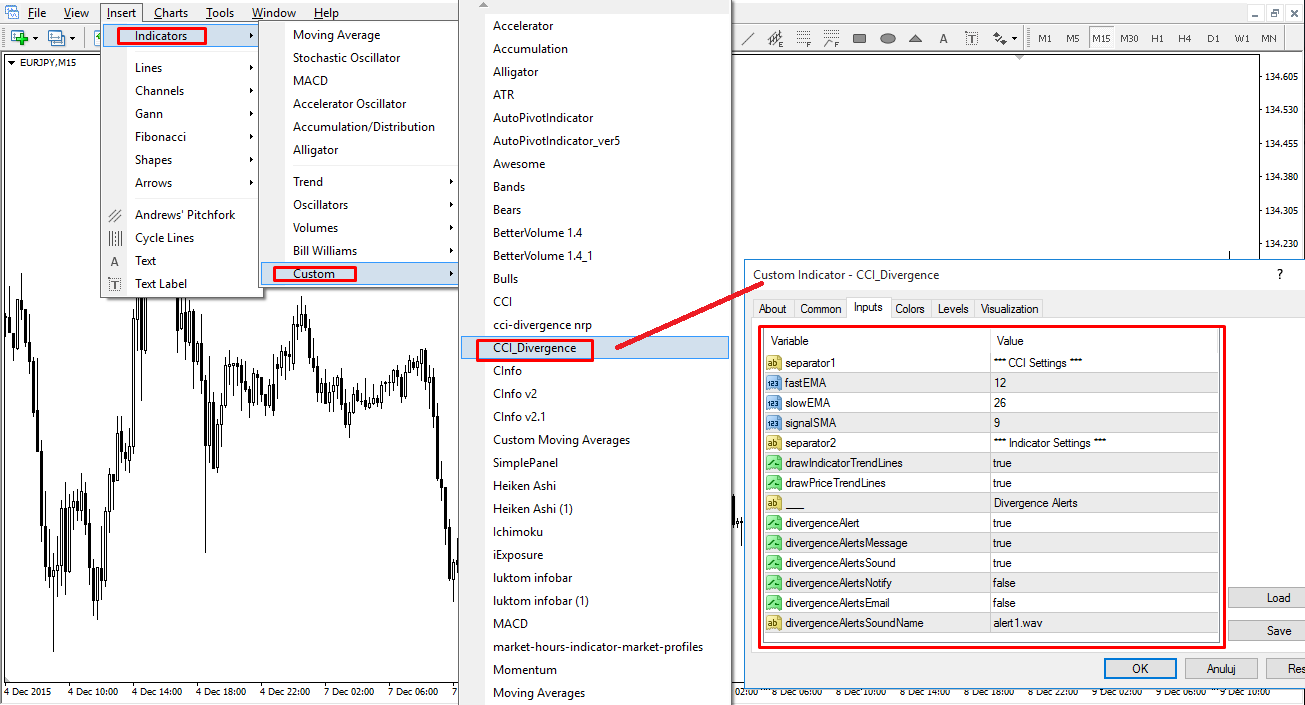
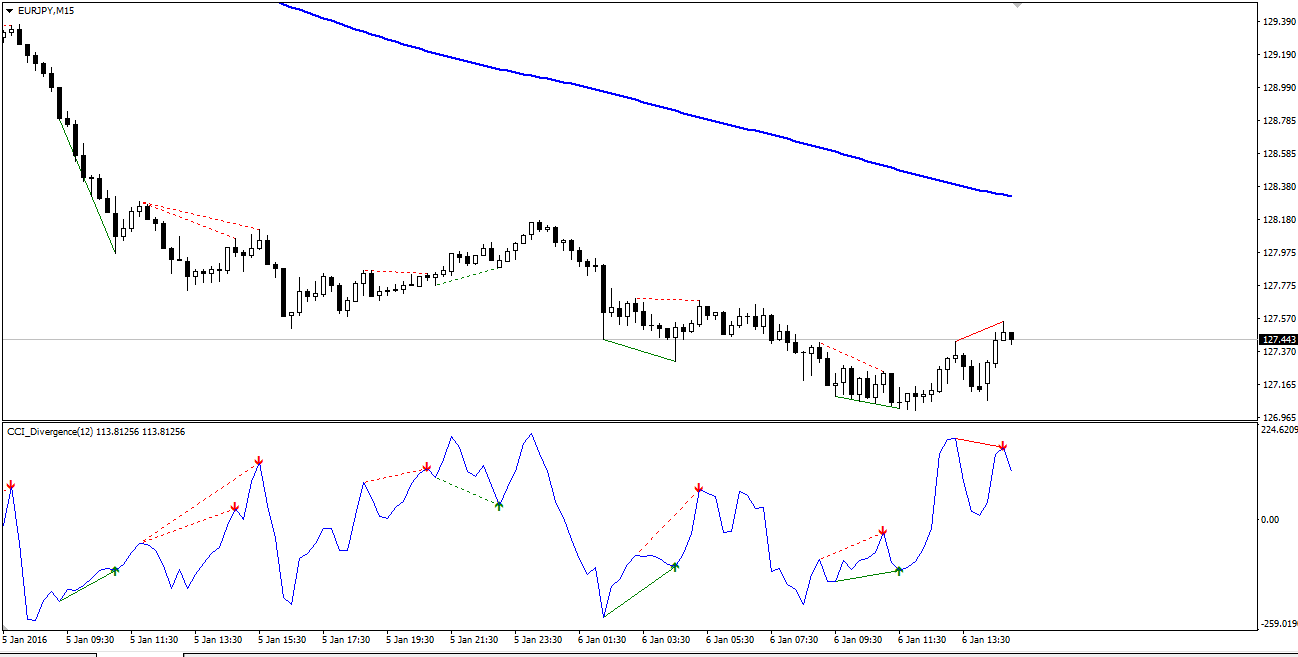
Our chart should now look like the one below:
Determining the direction of the trend
The strategy assumes moving with the trend, so the first step is to precisely determine the current sentiment. For this purpose, we use the Exponential Moving Average of the two hundred periods (EMA 200). So if:
- the price is below the EMA 200 we have a downtrend,
- the price is above the 200 EMA we have an uptrend,
- Exponential Moving Average intersects the price, this means that there’s a consolidation (at that time didn’t speculate).
Waiting for a signal
After determining the trend (or lack thereof in the case of consolidation) we look at CCI_Divergence indicator, which is visible in the window at the bottom of the chart. The blue line is the indicator is CCI, while green and red lines show the divergence between the indications of the CCI, and the behavior of prices. Visible are also the arrows in the same colors, followed by the signal for the transaction CALL or PUT. After drawing arrows should also experience an audio alert on the MT4 platform and a message on the screen.
Action strategies for binary options
When CALL, when PUT?
We already know how to determine the trend, and we know the operation of the indicator CCI_Divergence. We can then go to the heart of the strategy, namely the choice of the appropriate binary option for us.
Foundations for the CALL option:
- the price is above the average of the EMA 200 (uptrend),
- CCI_Divergence indicator informed us of the occurrence of a bullish divergence (green arrow indicator and the message on the screen, both visual and audible).
Foundations for the PUT option:
- the price is below the average of the EMA 200 (uptrend),
- CCI_Divergence indicator informed us of the occurrence of a bearish divergence (red arrow indicator and the message on the screen, both visual and audible).
Guidelines strategy are very simple and shouldn’t cause any problems even experienced traders. Note, however, that in the case of CALL option only react to the bullish divergence (green arrow indicator CCI_Divergence) and for PUT only bearish divergence (red arrow).
How to do it?
CALL option
We have all the elements of our uncomplicated strategy. Let’s get to show step-by-step analysis of how it should look and the same transaction. The following example will be shown for the uptrend and binary option CALL:
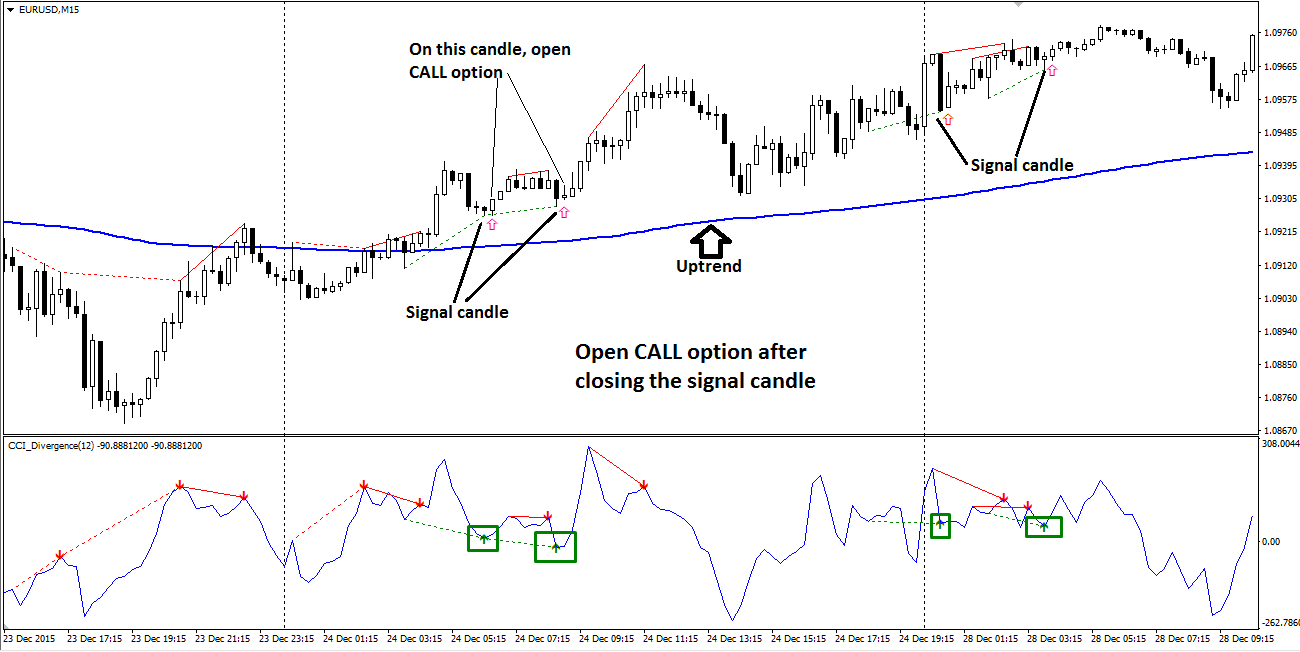
In the above chart clearly shows the uptrend (the price moves above the exponential average of 200 periods) and therefore we focus only on the signals CCI_Divergence indicator that inform us about the bullish divergence (green arrows in the indicator’s window). Immediately after the signal open call options with expiration date after 15 or 30 minutes.
PUT option
Now we’ll signals for the PUT option. Immediately we will chart with examples.
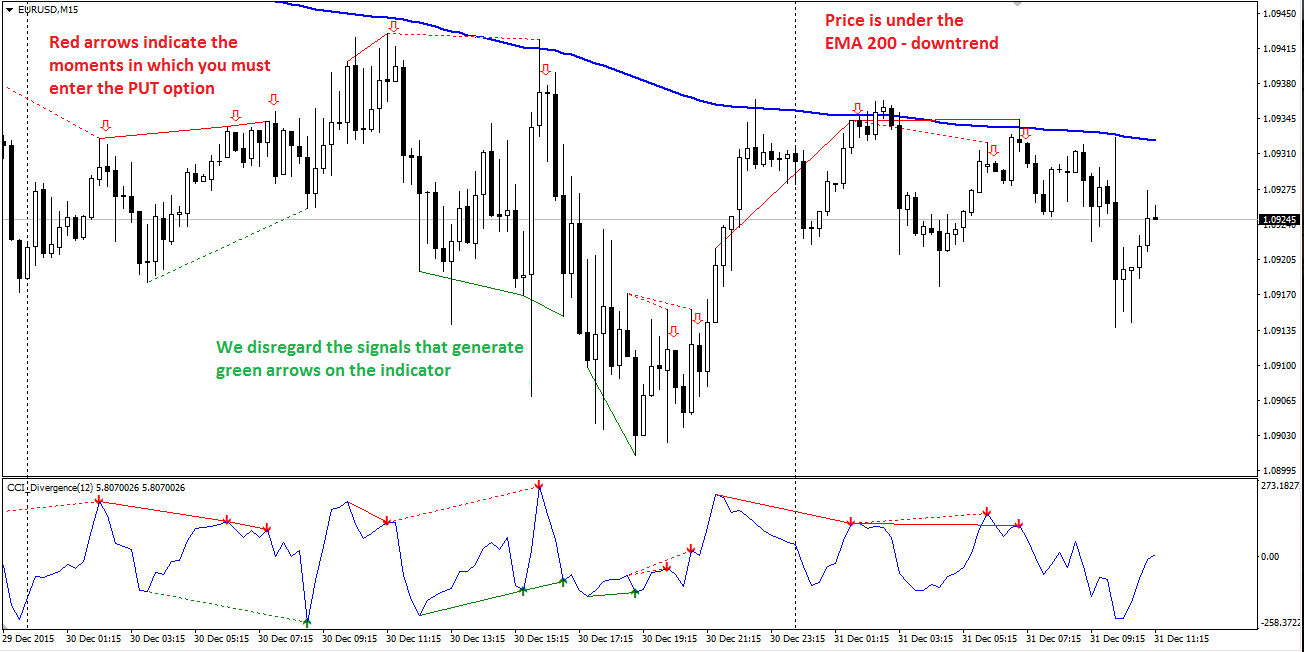
As described in the chart, the price is in a downtrend due to its presence at the EMA 200. For this reason we omit any signals informing us about the bullish divergence (green arrows) and accept only those that tell us about the bearish divergence – red arrows on the indicator CCI.


