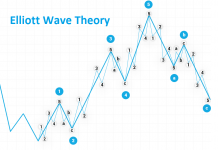
 „Searching, Analysing, Trading” is a series of analyses designed for an investment strategy based on Price Action and Elliott Waves. Its step-by-step description can be found in this link. We kindly invite you to follow our today’s review of selected currency pairs and potential opportunities for transactions.
Our analyses are prepared based on Ducascopy’s SWFX Sentiment Index, available here.
EUR/USD
The attempt made by this pair yesterday to go beyond the upper limit of the resistance zone has been stopped for now. We have wave 3 up and the Pin Bar formed yesterday may lead to a small correction as part of wave 4 or to complete the entire structure, leading to another wave down. Until the support zone has been permanently breached, both of the scenarios outlined by me yesterday are still possible – therefore all we can do is wait. We still don’t know whether the last wave 5 down, which is a clear impulse, constitutes wave 5 ending the whole decline, or the beginning of another wave down. Judging by its appearances and character, it totally doesn’t fit ending wave 5– hence the downward scenario is the base one.
On the Ichimoku chart, the pair, having breached the Kijun D1 line, reached its first destination, i.e. Senkou Span A. The Pin Bar has tentatively rejected that line, which may result in a retest of Kijun D1. Taking into consideration the two scenarios, it is a reaction to Kijun D1 that will play a crucial role. For now, waiting is the best strategy.
The partner of “Search, Analyse, Trade” series is a Dukascopy Europe broker who gives its customers access to ECN accounts in different currencies.
Trade on Forex, indices and commodities thanks to Swiss FX & CFD Marketplace. Open free trading account right now.
GBP/USD
The pair has rejected the resistance zone and yesterday we saw it attempt to fall, which may lead to a test of the inner line. If the pair rejects it, we may anticipate another wave up as part of wave 3c. If the price declines below that line, most probably there will be a test of the nearest support zone. The structure that is developing now resembles a triangle and if that is the case, we should be now at the beginning of its wave e. This is indicating declines as part of the last sub-wave, which should at least reach the area of 1.3100.
On the Ichimoku chart, the pair tentatively rejected the Kijun D1 line, which should result in a test of Tenkan D1. The level that the pair rejected is Tenkan W1 and Senkou Span A W1, which, in combination, creates a robust resistance for the price. At present I am waiting until those lines are broken or for declines below Kijun and Tenkan D1 and their retest.
JPY/USD
The pair keeps struggling with a solid resistance zone. Yesterday, it succeeded in breaching the lower line drawn on the peaks and reaching the first limit of the zone coinciding with the line drawn on the last peak. Once that level is breached, it should put an end to the strenuous climbing efforts we have been witnessing for some time and pick up speed. If this scenario plays out, the pair’s next destination should be the 112.300 level.
On the Ichimoku chart, the pair, having retested the Tenkan D1 line, headed north. It should reach the cloud on the weekly TF at any moment and if it is breached, a path to bigger advance will be open. After taking a peak at sentiment, where the number of shorts jumped up, we can anticipate acceleration of the move by closing short positions if the nearest resistance zone is breached. As I wrote yesterday, I am now waiting until the levels being tested are breached and for their retest. Only then will I get down to looking for positions to trade trend continuation.
Translation: Mirosław Wilk


