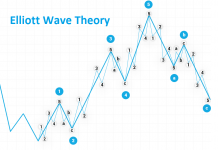
 „Searching, Analysing, Trading” is a series of analyses designed for an investment strategy based on Price Action and Elliott Waves. Its step-by-step description can be found in this link. We kindly invite you to follow our today’s review of selected currency pairs and potential opportunities for transactions.
Our analyses are prepared based on Ducascopy’s SWFX Sentiment Index, available here.
EUR/USD
Yesterday the pair breached the inner line that is now acting as support for the price. The impulse up triggered off recently – growing ever so strongly, seems to be something more than a mere correction of the last declines. It looks like the pair could test the 1.1750 level in the nearest future, where the resistance level is located. Wave 5 up has been forming starting from the bottom, which may mean an irregular correction and once it is complete and the zone is rejected, we will see declines as part of wave 3. Based on our second alternative, it will be wave 1 of a larger reaction and will fit into a scenario in which the move down is complete.
On the Ichimoku chart, the pair on W1 TF is sitting right under the Senkou Span A line that overlaps with the resistance level mentioned above, i.e. 1.1750. It is that level where it will turn out which scenario plays out. On the daily chart the pair is hovering above the Kijun and Tenkan Lines, yet they have been merely touched, not breached. The Chikou line is approaching the price with increased intensity. The price may bounce off that line and initiate another wave down. Sentiment strongly backs the downward scenario – that’s why at present I will be looking to open a short position, i.e. trade wave 3. Only a strong defeat of Kijun D1 will change my approach.
The partner of “Search, Analyse, Trade” series is a Dukascopy Europe broker who gives its customers access to ECN accounts in different currencies.
Trade on Forex, indices and commodities thanks to Swiss FX & CFD Marketplace. Open free trading account right now.
GBP/USD
The latest impulse up that formed on GBP/USD after completion of wave 5 down and rejection of the support zone, reached the 1.3300 level – which is very important and has been tested many times and initiated major moves. Rejection of that level should result in another wave down as part of extended wave 5. As is the case with EUR/USD, also here the wave up starting from the bottom is a 5 and similar scenarios are possible here, as well. A strong rejection of the resistance level will imply completion of wave C of an irregular correction and declines towards the nearest support. However, a quiet correction in the area of the inner line means probable continuation of gains as part of wave 3C.
On the weekly Ichimoku chart, GBP/USD is defending the Senkou Span A, off which the pair has bounced three times recently, thus constituting a strong support which may stand in the way of our downward scenario. I still expect that the last gains are a correction of the impulse down and, with sentiment currently at a neutral level, I will look for a short position. On the daily chart, the pair has reached the Kijun and Tenkan lines and for the time being is bouncing off the latter. On the H4 chart, the pair is squeezed between a thin descending cloud and the distance from the Kijun H4 line is sufficiently remote for me to wait for a dynamic impulse down and will be watching out for a signal to enter a position once a correction occurs.
USD/JPY
The pair has succeeded in defending the support level, which it has been struggling with for several days, for a third time. Another Pin Bar is forming and if it is sustained until the candlestick completes, there will be a probability that the moves up continue. At the current juncture, it is hard to tell which of the scenarios we outlined before will be the correct one – that’s why it is better to wait for a stronger directive impulse. Our base scenario assumed that the current decline is the beginning of wave C. As it stands, the defence of the support level and the candlesticks that have been formed do not fit into this scenario that much. The pair is also facing the last chance to play out a 1212 sequence, which will be negated if the nearest bottom is breached.
On the daily Ichimoku chart, we can see how much of a support the current levels are, which is demonstrated by the long and thin Kijun line. Until it is clearly breached, no downward scenario comes into play. Another obstacle facing the price is Senkou Span A, which is being tested. Current sentiment favours gains, but a signal to trade is still a very remote perspective. On the H4 chart, the pair is sitting under Tenkan, Kijun and the cloud, so in order to open a long position, all those lines need to be breached.
Translation: Mirosław Wilk


