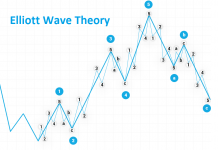
 „Searching, Analysing, Trading” is a series of analyses designed for an investment strategy based on Price Action and Elliott Waves. Its step-by-step description can be found in this link. We kindly invite you to follow our today’s review of selected currency pairs and potential opportunities for transactions.
Our analyses are prepared based on Ducascopy’s SWFX Sentiment Index, available here.
EUR/USD
The pair is struggling to breach the resistance zone, which I consider to be crucial when it comes to the playing-out of the scenario involving another wave down as part of continuation of the last impulse. If the pair manages to hold its current levels, that scenario will be negated and the one that completes the impulse down initiated at the beginning of the year kicks in as the basic one. In that case, a larger correction of the whole wave down will become plausible. Currently, the pair is forming wave 3 and if it triggers off an impulse, there will be a chance for continued gains towards, first, the 1.1830 and then the 1.1950 level.

On the Ichimoku chart, we can see that the pair breached the Kijun D1 line and is struggling with Senkou Span A of the descending cloud. This coincides with the location of the Tenkan W1 lline. Once those levels are broken, a path will become open towards the flat Senkou Span B D1 line. Taking a peak at Sentiment, which has recently been moving towards shorts, we can expect, if the nearest resistance level is breached, a stronger move up as part of wave 3 and the fulfillment of the scenario with a larger correction forming for this pair. At present I am waiting for a retest of the Kijun D1 line, where I will be watching out for a long position.
The partner of “Search, Analyse, Trade” series is a Dukascopy Europe broker who gives its customers access to ECN accounts in different currencies.
Trade on Forex, indices and commodities thanks to Swiss FX & CFD Marketplace. Open free trading account right now.
GBP/USD
The pair has also succeeded in breaching the resistance zone and this move, for all intents and purposes, negates the scenario involving the formation of an ending triangle as part of extended wave 5. It is quite probable that the triangle has been already completed by means of the last wave down and now it is awaiting a reaction to the last declines. The nearest resistance zone is sitting around the 1.2450 and this is where the pair should be heading now. This process also involves creating an impulse and if the pair breaches the said resistance zone, one can assume that the recent declines have ended, and a larger correction is developing. The impulse that is being formed is worth our attention, because if we assume in one of our scenarios that wave 5 of the large impulse down was not extended, then the resulting wave 3 down may be an ab wave as part of an irregular correction, and the advance we are observing is its wave c.
On the Ichimoku chart, we can see that the pair has breached the Kijun D1 line, which may imply an inclination to move towards Senkou Span A D1. Currently the pair is struggling with the Tenkan W1 line and once it has been broken, a way will be open to further gains. At present I am waiting for a correction and a retest of the Kijun D1 line. And if this scenario plays out, I will look for a position to trade reactions on a larger scale.
USD/JPY
USD/JPY par has been the least eventful of all, which should not be surprising as it has been moving within an ascending channel and is hovering right underneath a key resistance zone. We have a zone running across the last peak and a line drawn on the preceding peaks. Only once they have been breached, will a larger move up be enabled. Last week the pair rejected the said levels, yet no major reaction can be observed on the supply end. We are witnessing a correction that may reach the nearest support and the accelerated trend line. This should be the place where we will find out conclusively whether we are dealing with a local correction, or the beginning of major declines.
On the Ichimoku chart, the pair is continuing with an upward trend. All the lines are pointed upwards and currently the pair is testing the Tenkan D1 line and quite possibly it will be soon testing Kijun D1 line that is approaching the price. We should find out, based on a reaction to those lines, in what direction the price will move in the nearest future. At present, I am sitting on my hands, waiting until the resistance levels located right below the price are breached. Only then will I come to the conclusion that the upward scenario is the basic one and start thinking of trading a long position, following a retest.
Translation: Mirosław Wilk


