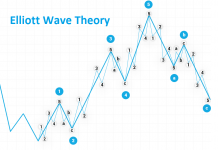
 „Searching, Analysing, Trading” is a series of analyses designed for an investment strategy based on Price Action and Elliott Waves. Its step-by-step description can be found in this link. We kindly invite you to follow our today’s review of selected currency pairs and potential opportunities for transactions.
Our analyses are prepared based on Ducascopy’s SWFX Sentiment Index, available here.
EUR/USD
The pair remains in a corrective move, triggered off aby a reaction to the support zone located around the 1,1530 area. Currently this move reached the inner line, where a supply reaction appeared. Observing the chart from the wave perspective, we can assume two scenarios. According to the first one, the last wave down is wave 5 of the whole impulse down initiated at the beginning of the year. In such a case, we should see continuation of the rebound and formation of a larger corrective structure. The second one regards the last wave down as wave 1. In that case the current gains should be considered as its correction, following which we should see continuation of declines.
On the Ichimoku chart, the pair tested the area right above the Kijun M1 line and is currently struggling to keep the Senkou Spam A of the descending cloud. The rebound reached the Kijun and Tenkan D1 and a perfect place for its initiation. A strong rejection of the line should give an entry signal on the Hchart, where the pair is right now sitting in a small descending cloud. A breach of the Kijun D1 will negate this scenario and we may start gradually contemplating the first one.
GBP/USD
The pair was stuck today between two levels and only once one of them is broken, will we be able to create a scenario. So far, the scenario with an extended wave 5 has not been negated and this is serving as a basis for me. A strong reaction to the level being tested now is needed in order for that scenario to play out or formation of another wave up as part of wave c of the simple correction, i.e. another test of the resistance level rejected on Friday. Once the rebound has ended, we should see another wave down (provided no subsequent extensions are formed).
On the Ichimoku chart, the pair found itself between a rock and a hard place. If we have a look at the M1 chart, we will see that the pair, having breached and retested the Kijun line, keeps continuing declines. However, on the W1 chart, it ended up on the Senkou Span A line, which it is trying to defend. Even a nice Pin Bar was created. The space takes up about 250 pips and we will see a stronger move only once one of those lines gets breached. Coming back to D1, the pair, as was the case with EUR/USD, reached Tenkan and Kijun. If a declining scenario is to play out, this line should get rejected. On the H4 chart, the pair is sitting right under the descending cloud and its retest and subsequent rejection may be an occasion to take a position. The problem is that the impulse that formed starring from the bottom, is wave 5 – therefore its continuation is possible. Thus, I refrain myself from a decision until wave c completes.
The partner of “Search, Analyse, Trade” series is a Dukascopy Europe broker who gives its customers access to ECN accounts in different currencies.
Trade on Forex, indices and commodities thanks to Swiss FX & CFD Marketplace. Open free trading account right now.
USD/JPY
The pair failed to sustain the support zone located in the area of the 109.950 level. By doing so, the pair negated the scenario involving sequence 1212. The second one is in play, according to which the gains we have observed recently were a simple correction of the wave down that developed following the rejection of the line that joins the tops. I still believe that what we are dealing with now is a correction of an impulse that was created from the bottom. Therefore, I have assumed two alternatives for the developing correction. The first one, it a simple abc correction. The second one, is formation of a complex structure, e.g. a triangle.
On the M1 Ichimoku chart, we can see that the pair got stuck between Kijun and Tenkan lines. This forms a box of merely 70 pips, therefore, in the nearest future, we should see some solutions and a breach of one of the lines. I assume this will be a breakout from the bottom and a breach of the Kijun line, which should result in major declines. On the daily chart, the pair breached Kijun M1 and reached Senkou Span A. If this is breached, it should open the way to a move towards Kijun M1. On the H4 chart, the pair is sitting under the cloud and waiting for its retest or a retest of Kijun D1. This is where I am planning to look for an entry to trade wave c.
Translation: Mirosław Wilk


