 The best way to gain knowledge is through experience. We present one of the thousands charts analysed by Elliott Waves International. We will tell you how to properly point waves in Elliott patterns.
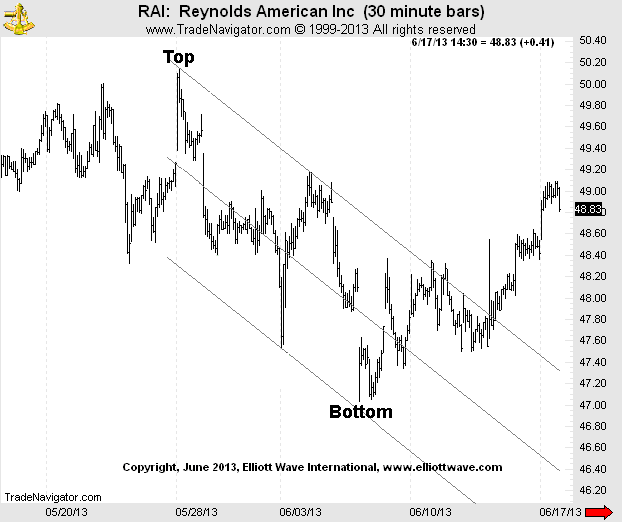
Can you see waves on the Reynolds American (RAI) chart below?
Elliott Waves theory divides market price on two categories: impulse and correction. You can see one of these on the chart below/
We encourage you to take closer look on the first chart and try to set another highs and lows creating waves by yourself. Remember about primary rule of five waves of impulse and three waves of corrections. When you finish, you can answer questions below:
- Is it impulse or correction?
- How is this pattern called (little tip: in case of impulse we recognize wave structure or wedge patter, in case of corrections there is zig-zag, shallow correction and triangle)
- Could you recognize which wave is it?
Our Senior Analyst – Jeffrey Kennedy – says:
“Main characteristic of this pattern is that it is usually within parallel lines. It is the most popular type of correction impulse”
Below we can check how Jeffrey look at this chart:

Notice that we use A-B-C marks to describe correction waves and numbers 1-5 to describe impulse waves.
Jeffrey noticed on this chart classic example of zig-zag, which is correction pattern consisting 3 waves, it is more common than triangles or flat corrections. As you probably noticed, our zig-zag has substructure 5-3-5 in which wave A builds 5 smaller waves before 3 waves of smaller correction impulse. Looking at the chart we can notice that also wave C consists of 5 smaller waves.
6 Lessons to Help You Find Trading Opportunities in Any MarketGet 6 free lessons that will teach you how to spot trading opportunities in the charts you’re using every day Elliott Wave International’s Jeffrey Kennedy shows you how to use Elliott waves, Fibonacci analysis, candlestick analysis, and more, to help you become a more successful technical trader. |
This article was syndicated by Elliott Wave International and was originally published under the headline How to Easily ID Support and Resistance on Your Charts. EWI is the world’s largest market forecasting firm. Its staff of full-time analysts led by Chartered Market Technician Robert Prechter provides 24-hour-a-day market analysis to institutional and private investors around the world.


